
Page 233 - Foundations of Marketing
P. 233
200 Part 3 | Customer Behavior and E-Marketing
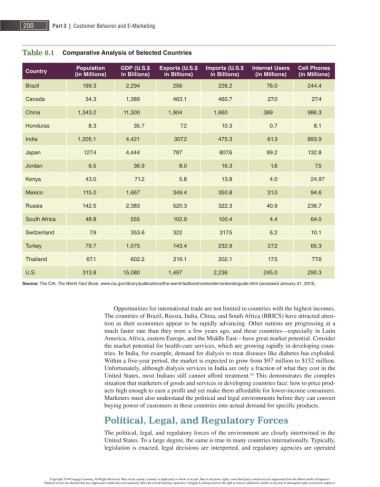
Table 8.1 Comparative Analysis of Selected Countries
Population GDP (U.S.$ Exports (U.S.$ Imports (U.S.$ Internet Users Cell Phones
Country
(in Millions) in Billions) in Billions) in Billions) (in Millions) (in Millions)
Brazil 199.3 2,294 256 226.2 76.0 244.4
Canada 34.3 1,389 463.1 460.7 27.0 27.4
China 1,343.2 11,300 1,904 1,660 389 986.3
Honduras 8.3 35.7 7.2 10.3 0.7 8.1
India 1,205.1 4,421 307.2 475.3 61.3 893.9
Japan 127.4 4,444 787 807.6 99.2 132.8
Jordan 6.5 36.9 8.0 16.3 1.6 7.5
Kenya 43.0 71.2 5.8 13.8 4.0 24.97
Mexico 115.0 1,667 349.4 350.8 31.0 94.6
Russia 142.5 2,383 520.3 322.3 40.9 236.7
South Africa 48.8 555 102.9 100.4 4.4 64.0
Switzerland 7.9 353.6 322 317.5 6.2 10.1
Turkey 79.7 1,075 143.4 232.9 27.2 65.3
Thailand 67.1 602.2 219.1 202.1 17.5 77.6
U.S. 313.8 15,080 1,497 2,236 245.0 290.3
Source: The CIA, The World Fact Book , www.cia.gov/library/publications/the-world-factbook/rankorder/rankorderguide.html (accessed January 31, 2013).
Opportunities for international trade are not limited to countries with the highest incomes.
The countries of Brazil, Russia, India, China, and South Africa (BRICS) have attracted atten-
tion as their economies appear to be rapidly advancing. Other nations are progressing at a
much faster rate than they were a few years ago, and these countries—especially in Latin
America, Africa, eastern Europe, and the Middle East—have great market potential. Consider
the market potential for health-care services, which are growing rapidly in developing coun-
tries. In India, for example, demand for dialysis to treat diseases like diabetes has exploded.
Within a five-year period, the market is expected to grow from $ 97 million to $ 152 million.
Unfortunately, although dialysis services in India are only a fraction of what they cost in the
16
United States, most Indians still cannot afford treatment. This demonstrates the complex
situation that marketers of goods and services in developing countries face: how to price prod-
ucts high enough to earn a profit and yet make them affordable for lower-income consumers.
Marketers must also understand the political and legal environments before they can convert
buying power of customers in these countries into actual demand for specific products.
Political, Legal, and Regulatory Forces
The political, legal, and regulatory forces of the environment are closely intertwined in the
United States. To a large degree, the same is true in many countries internationally. Typically,
legislation is enacted, legal decisions are interpreted, and regulatory agencies are operated
Copyright 2014 Cengage Learning. All Rights Reserved. May not be copied, scanned, or duplicated, in whole or in part. Due to electronic rights, some third party content may be suppressed from the eBook and/or eChapter(s).
Editorial review has deemed that any suppressed content does not materially affect the overall learning experience. Cengage Learning reserves the right to remove additional content at any time if subsequent rights restrictions require it.