
Page 422 - American Stories, A History of the United States
P. 422
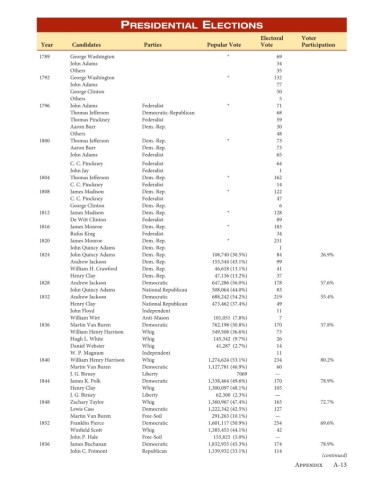
Presidential elections

                                                                                             Electoral     Voter
                     Year      Candidates              Parties              Popular Vote     Vote          Participation
                    1789       George Washington                                  *                69
                               John Adams                                                          34
                               Others                                                              35
                    1792       George Washington                                  *               132
                               John Adams                                                          77
                               George Clinton                                                      50
                               Others                                                              5
                    1796       John Adams             Federalist                  *                71
                               Thomas Jefferson       Democratic-Republican                        68
                               Thomas Pinckney        Federalist                                   59
                               Aaron Burr             Dem.-Rep.                                    30
                               Others                                                              48
                    1800       Thomas Jefferson       Dem.-Rep.                   *                73
                               Aaron Burr             Dem.-Rep.                                    73
                               John Adams             Federalist                                   65
                               C. C. Pinckney         Federalist                                   64
                               John Jay               Federalist                                   1
                    1804       Thomas Jefferson       Dem.-Rep.                   *               162
                               C. C. Pinckney         Federalist                                   14
                    1808       James Madison          Dem.-Rep.                   *               122
                               C. C. Pinckney         Federalist                                   47
                               George Clinton         Dem.-Rep.                                    6
                    1812       James Madison          Dem.-Rep.                   *               128
                               De Witt Clinton        Federalist                                   89
                    1816       James Monroe           Dem.-Rep.                   *               183
                               Rufus King             Federalist                                   34
                    1820       James Monroe           Dem.-Rep.                   *               231
                               John Quincy Adams      Dem.-Rep.                                    1
                    1824       John Quincy Adams      Dem.-Rep.              108,740 (30.5%)       84            26.9%
                               Andrew Jackson         Dem.-Rep.              153,544 (43.1%)       99
                               William H. Crawford    Dem.-Rep.               46,618 (13.1%)       41
                               Henry Clay             Dem.-Rep.               47,136 (13.2%)       37
                    1828       Andrew Jackson         Democratic             647,286 (56.0%)      178            57.6%
                               John Quincy Adams      National Republican    508,064 (44.0%)       83
                    1832       Andrew Jackson         Democratic             688,242 (54.2%)      219            55.4%
                               Henry Clay             National Republican    473,462 (37.4%)       49
                               John Floyd             Independent                                  11
                               William Wirt           Anti-Mason              101,051  (7.8%)      7
                    1836       Martin Van Buren       Democratic             762,198 (50.8%)      170            57.8%
                               William Henry Harrison  Whig                  549,508 (36.6%)       73
                               Hugh L. White          Whig                    145,342  (9.7%)      26
                               Daniel Webster         Whig                     41,287  (2.7%)      14
                               W. P. Magnum           Independent                                  11
                    1840       William Henry Harrison  Whig                 1,274,624 (53.1%)     234            80.2%
                               Martin Van Buren       Democratic            1,127,781 (46.9%)      60
                               J. G. Birney           Liberty                        7069         —
                    1844       James K. Polk          Democratic            1,338,464 (49.6%)     170            78.9%
                               Henry Clay             Whig                  1,300,097 (48.1%)     105
                               J. G. Birney           Liberty                  62,300  (2.3%)     —
                    1848       Zachary Taylor         Whig                  1,360,967 (47.4%)     163            72.7%
                               Lewis Cass             Democratic            1,222,342 (42.5%)     127
                               Martin Van Buren       Free-Soil              291,263 (10.1%)      —
                    1852       Franklin Pierce        Democratic            1,601,117 (50.9%)     254            69.6%
                               Winfield Scott         Whig                  1,385,453 (44.1%)      42
                               John P. Hale           Free-Soil               155,825  (5.0%)     —
                    1856       James Buchanan         Democratic            1,832,955 (45.3%)     174            78.9%
                               John C. Frémont        Republican            1,339,932 (33.1%)     114
                                                                                                                 (continued)
                                                                                                         Appendix       A-13