
Page 424 - American Stories, A History of the United States
P. 424
Electoral Voter
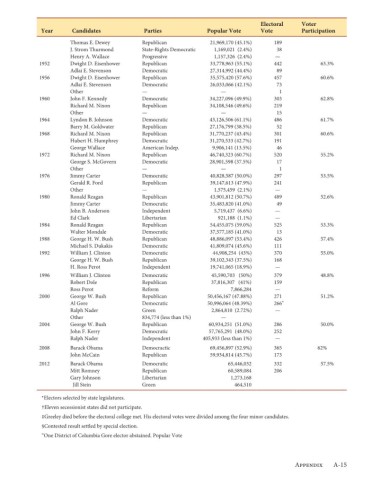
Year Candidates Parties Popular Vote Vote Participation
Thomas E. Dewey Republican 21,969,170 (45.1%) 189
J. Strom Thurmond State-Rights Democratic 1,169,021 (2.4%) 38
Henry A. Wallace Progressive 1,157,326 (2.4%) —
1952 Dwight D. Eisenhower Republican 33,778,963 (55.1%) 442 63.3%
Adlai E. Stevenson Democratic 27,314,992 (44.4%) 89
1956 Dwight D. Eisenhower Republican 35,575,420 (57.6%) 457 60.6%
Adlai E. Stevenson Democratic 26,033,066 (42.1%) 73
Other — — 1
1960 John F. Kennedy Democratic 34,227,096 (49.9%) 303 62.8%
Richard M. Nixon Republican 34,108,546 (49.6%) 219
Other — — 15
1964 Lyndon B. Johnson Democratic 43,126,506 (61.1%) 486 61.7%
Barry M. Goldwater Republican 27,176,799 (38.5%) 52
1968 Richard M. Nixon Republican 31,770,237 (43.4%) 301 60.6%
Hubert H. Humphrey Democratic 31,270,533 (42.7%) 191
George Wallace American Indep. 9,906,141 (13.5%) 46
1972 Richard M. Nixon Republican 46,740,323 (60.7%) 520 55.2%
George S. McGovern Democratic 28,901,598 (37.5%) 17
Other — — 1
1976 Jimmy Carter Democratic 40,828,587 (50.0%) 297 53.5%
Gerald R. Ford Republican 39,147,613 (47.9%) 241
Other — 1,575,459 (2.1%) —
1980 Ronald Reagan Republican 43,901,812 (50.7%) 489 52.6%
Jimmy Carter Democratic 35,483,820 (41.0%) 49
John B. Anderson Independent 5,719,437 (6.6%) —
Ed Clark Libertarian 921,188 (1.1%) —
1984 Ronald Reagan Republican 54,455,075 (59.0%) 525 53.3%
Walter Mondale Democratic 37,577,185 (41.0%) 13
1988 George H. W. Bush Republican 48,886,097 (53.4%) 426 57.4%
Michael S. Dukakis Democratic 41,809,074 (45.6%) 111
1992 William J. Clinton Democratic 44,908,254 (43%) 370 55.0%
George H. W. Bush Republican 39,102,343 (37.5%) 168
H. Ross Perot Independent 19,741,065 (18.9%) —
1996 William J. Clinton Democratic 45,590,703 (50%) 379 48.8%
Robert Dole Republican 37,816,307 (41%) 159
Ross Perot Reform 7,866,284 —
2000 George W. Bush Republican 50,456,167 (47.88%) 271 51.2%
Al Gore Democratic 50,996,064 (48.39%) 266"
Ralph Nader Green 2,864,810 (2.72%) —
Other 834,774 (less than 1%) —
2004 George W. Bush Republican 60,934,251 (51.0%) 286 50.0%
John F. Kerry Democratic 57,765,291 (48.0%) 252
Ralph Nader Independent 405,933 (less than 1%) —
2008 Barack Obama Democractic 69,456,897 (52.9%) 365 62%
John McCain Republican 59,934,814 (45.7%) 173
2012 Barack Obama Democratic 65,446,032 332 57.5%
Mitt Romney Republican 60,589,084 206
Gary Johnson Libertarian 1,273,168
Jill Stein Green 464,510
*Electors selected by state legislatures.
†Eleven secessionist states did not participate.
‡Greeley died before the electoral college met. His electoral votes were divided among the four minor candidates.
§Contested result settled by special election.
“One District of Columbia Gore elector abstained. Popular Vote
Appendix A-15