
Page 101 - Environment: The Science Behind the Stories
P. 101
that feed on plankton-eating fish. (The left side of Figure more energy per calorie that we gain than when we eat plant
4.9 shows these relationships in a very generalized form.) products.
Zebra mussels and quagga mussels, by eating both phy-
toplankton and zooplankton, function on multiple trophic
levels. When an organism dies and sinks to the bottom, WEIGhING thE ISSUES
detritivores scavenge its tissues and decomposers recycle
its nutrients. thE FOOtPrINtS OF OUr dIEtS What proportion of your diet
would you estimate consists of meat, milk, eggs, or other
animal products? Would you be willing to decrease this pro-
portion in order to reduce your ecological footprint? Describe
Energy, biomass, and numbers decrease some other ways in which you could reduce your footprint
at higher trophic levels through your food choices.
At each trophic level, organisms use energy in cellular respi-
ration (p. 50) to grow and maintain themselves. More energy Food webs show feeding relationships
goes toward maintenance than to building new tissues, and and energy flow
most ends up being given off as heat. Only a small amount
of the energy is transferred to the next trophic level through As energy is transferred from lower trophic levels to higher
predation, herbivory, or parasitism. A general rule of thumb ones, it is said to pass up a food chain, a linear series of feed-
is that each trophic level contains just 10% of the energy of ing relationships. Plant, grasshopper, rodent, and hawk make
the trophic level below it (although the actual proportion can up a food chain—as do phytoplankton, zooplankton, fish, and
vary greatly). This pattern can be visualized as a pyramid fish-eating birds.
(Figure 4.10). Thinking in terms of food chains is conceptually use-
This pyramid-like pattern also tends to hold for the ful, but ecological systems are far more complex than sim-
numbers of organisms at each trophic level; in general, ple linear chains. A more accurate representation of the
fewer organisms exist at higher trophic levels than at feeding relationships in a community is a food web—a
lower ones. A grasshopper eats many plants in its lifetime, visual map of energy flow that uses arrows to show the
a rodent eats many grasshoppers, and a hawk eats many many paths along which energy passes as organisms con-
rodents. Thus, for every hawk in a community there must sume one another.
be many rodents, still more grasshoppers, and an immense Figure 4.11 shows a food web from a temperate decidu-
number of plants. Moreover, because the difference in ous forest of eastern North America. It is greatly simplified
numbers of organisms among trophic levels tends to be and leaves out the vast majority of species and interactions that
large, the same pyramid-like relationship often holds true occur. Note, however, that even within this simplified diagram
for biomass, the collective mass of living matter in a given we can pick out a number of food chains involving different sets
place and time. of species.
The pyramid pattern illustrates why eating at lower A Great Lakes food web would involve the phyto-
trophic levels—being vegan or vegetarian, for instance— plankton that photosynthesize near the water’s surface, the
decreases a person’s ecological footprint. Each amount of zooplankton that eat them, fish that eat phytoplankton and
meat or other animal product we eat requires the input of a zooplankton, larger fish that eat the smaller fish, and lam-
considerably greater amount of plant material (see Figure 10.9, preys that parasitize the fish. It would include a number of
p. 267). Thus, when we eat animal products, we use up far native mussels and clams and, since 1988, the zebra mus-
sels and quagga mussels that are displacing them. It would
include diving ducks that formerly fed on native bivalves and
now prey on the mussels.
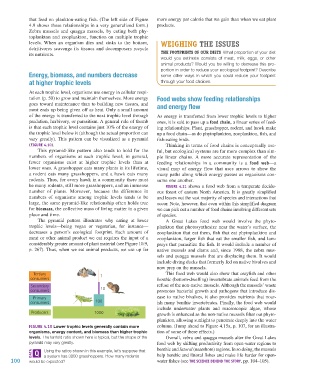
Tertiary 1 This food web would also show that crayfish and other
consumers benthic (bottom-dwelling) invertebrate animals feed from the
Secondary refuse of the non-native mussels. Although the mussels’ waste
consumers 10 promotes bacterial growth and pathogens that introduce dis-
Primary ease to native bivalves, it also provides nutrients that nour-
consumers 100 ish many benthic invertebrates. Finally, the food web would
include underwater plants and macroscopic algae, whose
Producers 1000 growth is enhanced as the non-native mussels filter out phyto-
plankton, allowing sunlight to penetrate deeply into the water
Figure 4.10 Lower trophic levels generally contain more column. (Jump ahead to Figure 4.15a, p. 107, for an illustra-
organisms, energy content, and biomass than higher trophic tion of some of these effects.)
levels. The tenfold ratio shown here is typical, but the shape of the Overall, zebra and quagga mussels alter the Great Lakes
pyramid may vary greatly. food web by shifting productivity from open-water regions to
Using the ratios shown in this example, let’s suppose that benthic and littoral (nearshore) regions. In so doing, the mussels
a system has 3000 grasshoppers. How many rodents help benthic and littoral fishes and make life harder for open-
100 would be expected? water fishes (see The Science behind The STory, pp. 104–105).
M04_WITH7428_05_SE_C04.indd 100 12/12/14 2:55 PM