
Page 97 - Environment: The Science Behind the Stories
P. 97
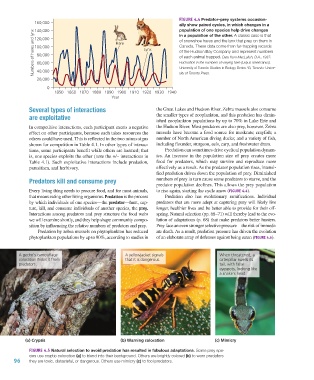
Figure 4.4 Predator–prey systems occasion-
                       160,000
                                                                                   ally show paired cycles, in which changes in a
                                                                                   population of one species help drive changes
                       140,000
                       Numbers of hares and lynx  120,000  Hare     Lynx           of snowshoe hares and the lynx that prey on them in
                                                                                   in a population of the other. A classic case is that
                                                                                   Canada. These data come from fur-trapping records
                       100,000
                                                                                   of the Hudson Bay Company and represent numbers
                        80,000
                                                                                   of each animal trapped. Data from MacLulich, D.A., 1937.
                                                                                   Fluctuation in the numbers of varying hare (Lepus americanus).
                        60,000
                        40,000
                                                                                   sity of Toronto Press.
                        20,000                                                     University of Toronto Studies in Biology Series 43, Toronto: Univer-
                            0
                               1850 1860 1870 1880 1890 1900 1910 1920 1930 1940
                                                       Year

                     Several types of interactions                       the Great Lakes and Hudson River. Zebra mussels also consume
                     are exploitative                                    the smaller types of zooplankton, and this predation has dimin-
                                                                         ished zooplankton populations by up to 70% in Lake Erie and
                     In competitive interactions, each participant exerts a negative   the Hudson River. Most predators are also prey, however. Zebra
                     effect on other participants, because each takes resources the   mussels have become a food source for muskrats; crayfish; a
                     others could have used. This is reflected in the two minus signs   number of North American diving ducks; and a variety of fish,
                     shown for competition in Table 4.1. In other types of interac-  including flounder, sturgeon, eels, carp, and freshwater drum.
                     tions, some participants benefit while others are harmed; that   Predation can sometimes drive cyclical population dynam-
                     is, one species exploits the other (note the +/– interactions in   ics. An increase in the population size of prey creates more
                     Table 4.1). Such exploitative interactions include predation,   food  for  predators,  which may survive  and reproduce more
                     parasitism, and herbivory.                          effectively as a result. As the predator population rises, intensi-
                                                                         fied predation drives down the population of prey. Diminished
                     Predators kill and consume prey                     numbers of prey in turn cause some predators to starve, and the
                                                                         predator population declines. This allows the prey population
                     Every living thing needs to procure food, and for most animals,   to rise again, starting the cycle anew (Figure 4.4).
                     that means eating other living organisms. Predation is the process   Predation also has evolutionary ramifications. Individual
                     by which individuals of one species—the predator—hunt, cap-  predators that are more adept at capturing prey will likely live
                     ture, kill, and consume individuals of another species, the prey.   longer, healthier lives and be better able to provide for their off-
                     Interactions among predators and prey structure the food webs   spring. Natural selection (pp. 68–71) will thereby lead to the evo-
                     we will examine shortly, and they help shape community compo-  lution of adaptations (p. 68) that make predators better hunters.
                     sition by influencing the relative numbers of predators and prey.  Prey face an even stronger selective pressure—the risk of immedi-
                        Predation by zebra mussels on phytoplankton has reduced   ate death. As a result, predation pressure has driven the evolution
                     phytoplankton populations by up to 90%, according to studies in   of an elaborate array of defenses against being eaten (Figure 4.5).


                 A gecko’s camouflage                        A yellowjacket signals                When threatened, a
                 coloration hides it from                    that it is dangerous.                 caterpillar swells its
                 predators.                                                                        tail, with false
                                                                                                   eyespots, looking like
                                                                                                   a snake’s head.


                   (a) Crypsis                             (b) Warning coloration                 (c) Mimicry
                     Figure 4.5 Natural selection to avoid predation has resulted in fabulous adaptations. Some prey spe-
                     cies use cryptic coloration (a) to blend into their background. Others are brightly colored (b) to warn predators
               96    they are toxic, distasteful, or dangerous. Others use mimicry (c) to fool predators.


           M04_WITH7428_05_SE_C04.indd   96                                                                                     12/12/14   2:55 PM