Page 172 - Environment: The Science Behind the Stories
P. 172

tsunami  boost  GDP  because  of  all  the  costs  incurred  in
                                                                             emergency measures and cleanup and rebuilding operations.
                                                                             War can augment GDP because of the economic activity
                                                                             involved in manufacturing weapons and servicing armies.
                                                                             Pollution causes GDP to increase when the polluting sub-
                                                                             stance is manufactured and again when society pays to clean
                                                                             up the pollution.
                                                                                 Some economists have tried to develop indicators that
                                                                             differentiate between desirable and undesirable economic
                                                                             activity and that can function as better guides to citizens’
                                                                             well-being. One such alternative to the GDP is the  Genu-
                                                                             ine Progress Indicator (GPI). To calculate GPI, economists
                                                                             begin with conventional economic activity and add to it
                                                                             positive contributions that are not paid for with money, such
                                                                             as volunteer work and parenting. They then subtract nega-
                                                                             tive impacts, such as crime and pollution (FIguRE 6.17a). The
                                                                             resulting  GPI  thereby  considers  more  activities  than  does
                                                                             the GDP, and it includes only those that enhance societal
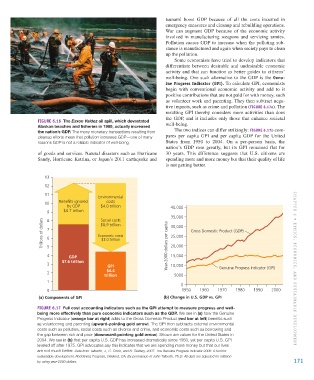
                        FIguRE 6.16  The Exxon Valdez oil spill, which devastated
                        Alaskan beaches and fisheries in 1989, actually increased   well-being.
                        the nation’s GDP. The many monetary transactions resulting from   The two indices can differ strikingly: FIguRE 6.17b com-
                        cleanup efforts mean that pollution increases GDP—one of many   pares per capita GPI and per capita GDP for the United
                        reasons GDP is not a reliable indicator of well-being.  States  from  1950  to  2004.  On  a  per-person  basis,  the
                                                                             nation’s GDP rose greatly, but its GPI remained flat for
                        of goods and services. Natural disasters such as Hurricane   30 years.  This difference suggests that U.S. citizens are
                        Sandy, Hurricane Katrina, or Japan’s 2011 earthquake and   spending more and more money but that their quality of life
                                                                             is not getting better.

                           13
                           12
                           11                    Environmental

                           10    Benefits ignored    costs
                                    by GDP        $4.0 trillion                40,000
                            9      $4.7 trillion
                                                                               35,000
                                                  Social costs
                          Trillions of dollars  7  Economic costs              30,000   Gross Domestic Product (GDP)
                            8
                                                  $0.9 trillion
                                                                               25,000
                            6
                                                   $3.0 trillion
                            5
                            4        GDP                                      Year-2000 dollars per capita  20,000
                                                                               15,000
                                  $7.6 trillion
                            3                        GPI                       10,000
                                                     $4.4                                          Genuine Progress Indicator (GPI)  CHAPTER 6 •  Ethi C s, E C ono mi C s,  A nd  s ustA in A bl E   dE v E lopm E nt
                            2
                                                    trillion                     5000
                            1
                                                                                    0
                            0                                                       1950   1960    1970   1980   1990    2000
                         (a) Components of GPI                              (b) Change in U.S. GDP vs. GPI

                        FIguRE 6.17  Full cost accounting indicators such as the GPI attempt to measure progress and well-
                        being more effectively than pure economic indicators such as the GDP. We see in (a) how the Genuine
                        Progress Indicator (orange bar at right) adds to the Gross Domestic Product (red bar at left) benefits such
                        as volunteering and parenting (upward-pointing gold arrow). The GPI then subtracts external environmental
                        costs such as pollution, social costs such as divorce and crime, and economic costs such as borrowing and
                        the gap between rich and poor (downward-pointing gold arrow). Shown are values for the United States in
                        2004. We see in (b) that per capita U.S. GDP has increased dramatically since 1950, yet per capita U.S. GPI
                        leveled off after 1975. GPI advocates say this indicates that we are spending more money but that our lives
                        are not much better. Data from Talberth, J., C. Cobb, and N. Slattery, 2007. The Genuine Progress Indicator 2006: A tool for
                        sustainable development. Redefining Progress, Oakland, CA. By permission of John Talberth, Ph.D. All data are adjusted for inflation
                        by using year-2000 dollars.                                                                               171


           M06_WITH7428_05_SE_C06.indd   171                                                                                    12/12/14   2:57 PM
   167   168   169   170   171   172   173   174   175   176   177