
Page 302 - Environment: The Science Behind the Stories
P. 302
went extinct. Birds, mammals, and reptiles vanished following 1.6
human arrival on many other oceanic islands, including large 1.4
island masses such as New Zealand and Madagascar. Dozens
of species of large vertebrates died off in Australia after peo- 1.2
ple arrived roughly 50,000 years ago, and North America lost 1.0
33 genera of large mammals after people arrived more than 0.8
10,000 years ago (see Figure 3.9, p. 76). Index (1970 = 1.0) 0.6 Living planet index
Current extinction rates are much higher 0.4 Terrestrial index
Marine index
0.2
than normal Freshwater index
0
Today, species loss is accelerating as our population growth 1970 1975 1980 1985 1990 1995 2000 2005 2010
and resource consumption put increasing strain on habitats and Year
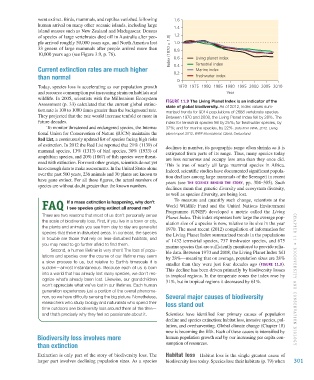
wildlife. In 2005, scientists with the Millennium Ecosystem Figure 11.9 The Living Planet Index is an indicator of the
Assessment (p. 33) calculated that the current global extinc- state of global biodiversity. As of 2012, index values sum-
tion rate is 100 to 1000 times greater than the background rate. marized trends for 9014 populations of 2688 vertebrate species.
They projected that the rate would increase tenfold or more in Between 1970 and 2008, the Living Planet Index fell by 28%. The
future decades. index for terrestrial species fell by 25%; for freshwater species, by
To monitor threatened and endangered species, the Interna- 37%; and for marine species, by 22%. Data from WWF, 2012. Living
tional Union for Conservation of Nature (IUCN) maintains the planet report 2012. WWF International, Gland, Switzerland.
Red List, a continuously updated list of species facing high risks
of extinction. In 2012 the Red List reported that 21% (1139) of declines in number, its geographic range often shrinks as it is
mammal species, 13% (1313) of bird species, 30% (1933) of extirpated from parts of its range. Thus, many species today
amphibian species, and 20% (1867) of fish species were threat- are less numerous and occupy less area than they once did.
ened with extinction. For most other groups, scientists do not yet This is true of nearly all large mammal species in Africa.
have enough data to make assessments. In the United States alone Indeed, scientific studies have documented significant popula-
over the past 500 years, 236 animals and 30 plants are known to tion declines among large mammals of the Serengeti in recent
have gone extinct. For all these figures, the actual numbers of years (see THe SCieNCe beHiND THe STOrY, pp. 304–305). Such
species are without doubt greater than the known numbers.
declines mean that genetic diversity and ecosystem diversity,
as well as species diversity, are being lost.
FAQ If a mass extinction is happening, why don’t World Wildlife Fund and the United Nations Environment
To measure and quantify such change, scientists at the
I see species going extinct all around me?
Programme (UNEP) developed a metric called the Living
There are two reasons that most of us don’t personally sense Planet Index. This index expresses how large the average pop-
the scale of biodiversity loss. First, if you live in a town or city, ulation size of a species is now, relative to its size in the year
the plants and animals you see from day to day are generalist 1970. The most recent (2012) compilation of information for
species that thrive in disturbed areas. In contrast, the species the Living Planet Index summarized trends in the populations
in trouble are those that rely on less-disturbed habitats, and of 1432 terrestrial species, 737 freshwater species, and 675
you may need to go further afield to find them. marine species that are sufficiently monitored to provide relia-
Second, a human lifetime is very short! The loss of popu- ble data. Between 1970 and 2008, the Living Planet Index fell
lations and species over the course of our lifetime may seem by 28%—meaning that on average, population sizes are 28%
a slow process to us, but relative to Earth’s timescale it is smaller than they were just four decades ago (Figure 11.9).
sudden—almost instantaneous. Because each of us is born This decline has been driven primarily by biodiversity losses
into a world that has already lost many species, we don’t rec- in tropical regions. In the temperate zones the index rose by
ognize what’s already been lost. Likewise, our grandchildren 31%, but in tropical regions it decreased by 61%. CHAPTER 11 • Bi odiv ER si T y A nd Cons ER vAT i on Bi ology
won’t appreciate what we’ve lost in our lifetimes. Each human
generation experiences just a portion of the overall phenome-
non, so we have difficulty sensing the big picture. Nonetheless, Several major causes of biodiversity
researchers who study biology and naturalists who spend their loss stand out
time outdoors see biodiversity loss around them all the time—
and that’s precisely why they feel so passionate about it. Scientists have identified four primary causes of population
decline and species extinction: habitat loss, invasive species, pol-
lution, and overharvesting. Global climate change (Chapter 18)
now is becoming the fifth. Each of these causes is intensified by
Biodiversity loss involves more human population growth and by our increasing per capita con-
than extinction sumption of resources.
Extinction is only part of the story of biodiversity loss. The Habitat loss Habitat loss is the single greatest cause of
larger part involves declining population sizes. As a species biodiversity loss today. Species lose their habitats (p. 79) when 301
M11_WITH7428_05_SE_C11.indd 301 12/12/14 3:00 PM