
Page 395 - Environment: The Science Behind the Stories
P. 395
comparisons among groups of people, usually contrasting
a group known to have been exposed to some hazard and a
group that has not. Epidemiologists track the fate of all people
in the study for a long period of time (often years or decades)
and measure the rate at which deaths, cancers, or other health
problems occur in each group. The epidemiologist then ana-
lyzes the data, looking for observable differences between the
groups, and statistically tests hypotheses accounting for dif-
ferences. When a group exposed to a hazard shows a signifi-
cantly greater degree of harm, it suggests that the hazard may
be responsible. For example, epidemiologists have tracked
asbestos miners for evidence of asbestosis, lung cancer, and
mesothelioma (cancer of the cells that line the body’s internal
organs). Survivors of the Chernobyl and Fukushima nuclear
disasters have been monitored for thyroid cancer and other
illnesses (pp. 580–581). Canadian epidemiologists are now
tracking people for impacts of bisphenol A exposure.
The epidemiological process is akin to a natural experi-
ment (p. 30), in which the experimenter studies groups of sub-
jects made possible by some event that has occurred. A similar
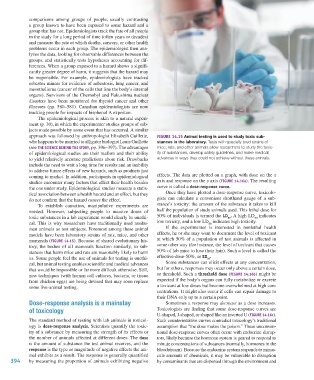
approach was followed by anthropologist Elizabeth Guillette, Figure 14.15 Animal testing is used to study toxic sub-
who happens to be married to alligator biologist Louis Guillette stances in the laboratory. Tests with specially bred strains of
(see The Science behind The STory, pp. 396–397). The advantages mice, rats, and other animals allow researchers to study the toxic-
of epidemiological studies are their realism and their ability ity of substances, develop safety guidelines, and make medical
to yield relatively accurate predictions about risk. Drawbacks advances in ways they could not achieve without these animals.
include the need to wait a long time for results and an inability
to address future effects of new hazards, such as products just
coming to market. In addition, participants in epidemiological effects. The data are plotted on a graph, with dose on the x
studies encounter many factors that affect their health besides axis and response on the y axis (Figure 14.16a). The resulting
the one under study. Epidemiological studies measure a statis- curve is called a dose-response curve.
tical association between a health hazard and an effect, but they Once they have plotted a dose-response curve, toxicolo-
do not confirm that the hazard causes the effect. gists can calculate a convenient shorthand gauge of a sub-
To establish causation, manipulative experiments are stance’s toxicity: the amount of the substance it takes to kill
needed. However, subjecting people to massive doses of half the population of study animals used. This lethal dose for
toxic substances in a lab experiment would clearly be unethi- 50% of individuals is termed the lD . A high LD indicates
50
50
cal. This is why researchers have traditionally used nonhu- low toxicity, and a low LD indicates high toxicity.
50
man animals as test subjects. Foremost among these animal If the experimenter is interested in nonlethal health
models have been laboratory strains of rats, mice, and other effects, he or she may want to document the level of toxicant
mammals (Figure 14.15). Because of shared evolutionary his- at which 50% of a population of test animals is affected in
tory, the bodies of all mammals function similarly, so sub- some other way (for instance, the level of toxicant that causes
stances that harm mice and rats are reasonably likely to harm 50% of lab mice to lose their hair). Such a level is called the
us. Some people feel the use of animals for testing is unethi- effective-dose-50%, or ED .
50
cal, but animal testing enables scientific and medical advances Some substances can elicit effects at any concentration,
that would be impossible or far more difficult otherwise. Still, but for others, responses may occur only above a certain dose,
new techniques (with human cell cultures, bacteria, or tissue or threshold. Such a threshold dose (Figure 14.16b) might be
from chicken eggs) are being devised that may soon replace expected if the body’s organs can fully metabolize or excrete
some live-animal testing. a toxicant at low doses but become overwhelmed at high con-
centrations. It might also occur if cells can repair damage to
their DNA only up to a certain point.
Dose-response analysis is a mainstay Sometimes a response may decrease as a dose increases.
of toxicology Toxicologists are finding that some dose-response curves are
U-shaped, J-shaped, or shaped like an inverted U (Figure 14.16c).
The standard method of testing with lab animals in toxicol- Such counterintuitive curves contradict toxicology’s traditional
ogy is dose-response analysis. Scientists quantify the toxic- assumption that “the dose makes the poison.” These unconven-
ity of a substance by measuring the strength of its effects or tional dose-response curves often occur with endocrine disrup-
the number of animals affected at different doses. The dose tors, likely because the hormone system is geared to respond to
is the amount of substance the test animal receives, and the minute concentrations of substances (normally, hormones in the
response is the type or magnitude of negative effects the ani- bloodstream). Because the endocrine system responds to minus-
mal exhibits as a result. The response is generally quantified cule amounts of chemicals, it may be vulnerable to disruption
394 by measuring the proportion of animals exhibiting negative by contaminants that are dispersed through the environment and
M14_WITH7428_05_SE_C14.indd 394 12/12/14 3:04 PM