
Page 563 - Environment: The Science Behind the Stories
P. 563
20 140 Dollar value of the day
Arab
Production 130 Dollar value in 2012 Hurricanes
Spring
Million barrels of oil per day 10 Crude oil prices (U.S. dollars per barrel) 100 OPEC oil Gulf Katrina & Rita
Consumption
120
Iranian
15
110
revolution
90
80
embargo
70
U.S.
60
War
5
Iraq
40
30
0 50 invades
Saudi Iran United Germany Japan 20 Recession
Arabia
States
10
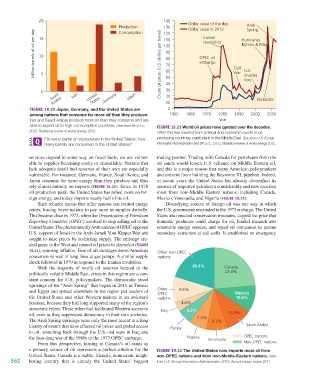
FIGURE 19.20 Japan, Germany, and the United States are 0
among nations that consume far more oil than they produce. 1950 1960 1970 1980 1990 2000 2010
Iran and Saudi Arabia produce more oil than they consume and are Year
able to export oil to high-consumption countries. Data from BP p.l.c., FIGURE 19.21 World oil prices have gyrated over the decades.
2012. Statistical review of world energy 2012. Often this has resulted from political and economic events in oil-
For every barrel of oil produced in the United States, how producing countries, particularly in the Middle East. Data from U.S. Energy
many barrels are consumed in the United States? Information Administration and BP p.l.c., 2012, Statistical review of world energy 2012.
services depend in some way on fossil fuels, we are vulner- trading partner. Trading with Canada for petroleum from the
able to supplies becoming costly or unavailable. Nations that oil sands would lessen U.S. reliance on Middle Eastern oil,
lack adequate fossil fuel reserves of their own are especially and this is a major reason that many American policymakers
vulnerable. For instance, Germany, France, South Korea, and and citizens favor building the Keystone XL pipeline. Indeed,
Japan consume far more energy than they produce and thus in recent years the United States has already diversified its
rely almost entirely on imports (FIGURE 19.20). Since its 1970 sources of imported petroleum considerably and now receives
oil production peak, the United States has relied more on for- most from non–Middle Eastern nations, including Canada,
eign energy, and today imports nearly half of its oil. Mexico, Venezuela, and Nigeria (FIGURE 19.22).
Such reliance means that seller nations can control energy Diversifying sources of foreign oil was one way in which
prices, forcing buyer nations to pay more as supplies dwindle. the U.S. government responded to the 1973 embargo. The United
This became clear in 1973, when the Organization of Petroleum States also enacted conservation measures, capped the price that
Exporting Countries (OPEC) resolved to stop selling oil to the domestic producers could charge for oil, funded research into
United States. The predominantly Arab nations of OPEC opposed renewable energy sources, and urged oil companies to pursue
U.S. support of Israel in the Arab–Israeli Yom Kippur War and secondary extraction at old wells. It established an emergency
sought to raise prices by restricting supply. The embargo cre-
ated panic in the West and caused oil prices to skyrocket (FIGURE
19.21), spurring inflation. Fear of oil shortages drove American Other non-OPEC
consumers to wait in long lines at gas pumps. A similar supply nations
shock followed in 1979 in response to the Iranian revolution.
With the majority of world oil reserves located in the 20.2% Canada
politically volatile Middle East, crises in this region are a con- 23.8%
stant concern for U.S. policymakers. The democratic street
uprisings of the “Arab Spring” that began in 2011 in Tunisia
and Egypt and spread elsewhere in the region put leaders of Other 9.8% Mexico
OPEC
the United States and other Western nations in an awkward nations 10.6%
position, because they had long supported many of the region’s 4.0%
autocratic rulers. These rulers had facilitated Western access to Iraq 5.5%
oil, even as they suppressed democracy in their own societies. 10.5%
The Arab Spring uprisings were only the most recent in a long 7.2% 8.3%
history of events that have affected oil prices and global access Russia Saudi Arabia
to oil, stretching back through the U.S.–led wars in Iraq and
the Iran–Iraq war of the 1980s to the 1973 OPEC embargo. Nigeria Venezuela OPEC nations
From this perspective, turning to Canada’s oil sands as Non-OPEC nations
a primary source of oil represents a perfect solution for the FIGURE 19.22 The United States now imports most oil from
United States. Canada is a stable, friendly, democratic neigh- non-OPEC nations and from non-Middle-Eastern nations. Data
562 boring country that is already the United States’ biggest from U.S. Energy Information Administration, 2012. Annual energy review 2011.
M19_WITH7428_05_SE_C19.indd 562 12/12/14 5:23 PM