
Page 602 - Environment: The Science Behind the Stories
P. 602
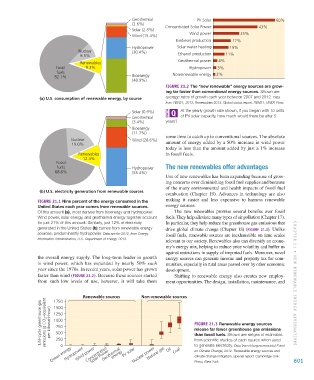
Geothermal                 PV Solar                         60%
                                                               (2.6%)        Concentrated Solar Power               43%
                                                               Solar (2.8%)
                                                               Wind (15.4%)            Wind power           25%
                                                                                 Biodiesel production    17%
                                                               Hydropower         Solar water heating   15%
                                         Nuclear               (30.4%)
                                          8.5%                                    Ethanol production  11%
                                          Renewables                              Geothermal power  4%
                                Fossil      9.3%                                       Hydropower  3%
                                fuels                                           Nonrenewable energy  2%
                               82.1%                           Bioenergy
                                                               (48.9%)
                                                                             Figure 21.2 The “new renewable” energy sources are grow-
                                                                             ing far faster than conventional energy sources. Shown are
                         (a) U.S. consumption of renewable energy, by source  average rates of growth each year between 2007 and 2012. Data
                                                                             from REN21, 2013. Renewables 2013: Global status report. REN21, UNEP, Paris.
                                                               Solar (0.9%)        At the yearly growth rate shown, if you began with 10 units
                                                               Geothermal          of PV solar capacity, how much would there be after 5
                                                               (3.4%)        years?
                                                               Bioenergy
                                                               (11.7%)
                                                                             some time to catch up to conventional sources. The absolute
                                      Nuclear                  Wind (28.6%)  amount of energy added by a 50% increase in wind power
                                      19.0%
                                                                             today is less than the amount added by just a 1% increase
                                         Renewables                          in fossil fuels.
                                           12.4%
                                Fossil
                                fuels                          Hydropower    The new renewables offer advantages
                               68.6%                           (55.4%)
                                                                             Use of new renewables has been expanding because of grow-
                                                                             ing concerns over diminishing fossil fuel supplies and because
                                                                             of the many environmental and health impacts of fossil fuel
                         (b) U.S. electricity generation from renewable sources
                                                                             combustion (Chapter 19). Advances in technology are also
                        Figure 21.1 Nine percent of the energy consumed in the   making it easier and less expensive to harness renewable
                        United States each year comes from renewable sources.   energy sources.
                        Of this amount (a), most derives from bioenergy and hydropower.   The new renewables promise several benefits over fossil
                        Wind power, solar energy, and geothermal energy together account   fuels. They help alleviate many types of air pollution (Chapter 17).
                        for just 21% of this amount. Similarly, just 12% of electricity   In particular, they help reduce the greenhouse gas emissions that
                        generated in the United States (b) comes from renewable energy   drive global climate change (Chapter 18) (Figure  21.3). Unlike
                        sources, predominantly hydropower. Data are for 2012, from Energy   fossil fuels, renewable sources are inexhaustible on time scales
                        Information Administration, U.S. Department of Energy, 2013.
                                                                             relevant to our society. Renewables also can diversify an econo-
                                                                             my’s energy mix, helping to reduce price volatility and buffer us
                                                                             against restrictions in supply of imported fuels. Moreover, novel
                        the overall energy supply. The long-term leader in growth   energy sources can generate income and property tax for com-
                        is  wind  power,  which  has  expanded  by  nearly  50%  each   munities, especially in rural areas passed over by other economic
                        year since the 1970s. In recent years, solar power has grown   development.
                        faster than wind (Figure 21.2). Because these sources started   Shifting to renewable energy also creates new employ-
                        from such low levels of use, however, it will take them   ment opportunities. The design, installation, maintenance, and   CHAPTER 21 • N E w R ENE wA bl E  E NER gy AlTERN AT iv E s


                                           Renewable sources       Non-renewable sources
                               1750
                          Life-cycle greenhouse gas emissions (g CO 2 -equivalent  per kilowatt-hour)  1250  Figure 21.3 Renewable energy sources
                               1500

                               1000
                                750
                                                                                         release far fewer greenhouse gas emissions
                                500
                                                                                         than fossil fuels. Shown are ranges of estimates
                                250
                                                                                         to generate electricity. Data from Intergovernmental Panel
                                  0
                                             Concentrated
                                    Hydropower
                              Ocean energy  Wind power Solar Power  energy  PV solar Nuclear power  Oil  Coal  from scientific studies of each source when used   601
                                                                      Natural gas
                                                   Geothermal
                                                                                         on Climate Change, 2012. Renewable energy sources and
                                                                                         climate change mitigation. Special report. Cambridge Univ.
                                                                                         Press, New York.


           M21_WITH7428_05_SE_C21.indd   601                                                                                    12/12/14   4:29 PM