
Page 614 - Environment: The Science Behind the Stories
P. 614
are a gearbox, a generator, and equipment to monitor and con-
trol the turbine’s activity. Today’s towers average 80 m (260 ft)
in height, and the largest are taller than a football field is long.
Higher is generally better, to minimize turbulence (and poten-
tial damage) while maximizing wind speed. Turbines are often China
erected in groups; such a development is called a wind farm. Rest of world (26.7%)
(26.4%)
The world’s largest wind farms contain hundreds of turbines
spread across the landscape.
Engineers design turbines to yaw, or rotate back and
forth in response to changes in wind direction, ensuring that India
the motor faces into the wind at all times. Some turbines (6.5%) United States
are designed to generate low levels of electricity by turning Spain (21.2%)
in light breezes. Others are programmed to rotate only in (8.1%)
strong winds, generating large amounts of electricity in short Germany
(11.1%)
time periods. Slight differences in wind speed yield substan-
tial differences in power output, for two reasons. First, the
energy content of wind increases as the square of its velocity; (a) Percentage of global wind power in each nation
thus if wind velocity doubles, energy quadruples. Second, an
increase in wind speed causes more air molecules to pass
through the wind turbine per unit time, making power output Denmark
equal to wind velocity cubed. Thus a doubled wind velocity Portugal
results in an eightfold increase in power output. Spain
Ireland
Germany
Wind power is growing fast United States
Like solar energy, wind provides just a small proportion of the
World
world’s power needs, but wind power is growing fast—doubling Average
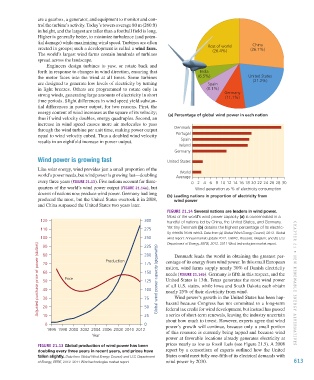
every three years (Figure 21.13). Five nations account for three- 0 2 4 6 8 10 12 14 16 18 20 22 24 26 28 30
quarters of the world’s wind power output (Figure 21.14a), but Wind generation as % of electricity consumption
dozens of nations now produce wind power. Germany had long (b) Leading nations in proportion of electricity from
produced the most, but the United States overtook it in 2008, wind power
and China surpassed the United States two years later.
Figure 21.14 Several nations are leaders in wind power.
Most of the world’s wind power capacity (a) is concentrated in a
120 300 handful of nations led by China, the United States, and Germany.
110 275 Yet tiny Denmark (b) obtains the highest percentage of its electric-
ity needs from wind. Data from (a) Global Wind Energy Council, 2013. Global
100 250 wind report: Annual market update 2012. GWEC, Brussels, Belgium; and (b) U.S.
Department of Energy, EERE, 2012. 2011 Wind technologies market report.
Adjusted purchase price of power (dollars) 70 Price Production 175 Global wind power capacity (gigawatts) centage of its energy from wind power. In this small European CHAPTER 21 • N E w R ENE wA bl E E NER gy AlTERN AT iv E s
225
90
200
80
Denmark leads the world in obtaining the greatest per-
nation, wind farms supply nearly 30% of Danish electricity
150
60
needs (Figure 21.14b). Germany is fifth in this respect, and the
United States is 13th. Texas generates the most wind power
125
50
of all U.S. states, while Iowa and South Dakota each obtain
40
100
nearly 25% of their electricity from wind.
Wind power’s growth in the United States has been hap-
30
75
hazard because Congress has not committed to a long-term
20
50
federal tax credit for wind development, but instead has passed
a series of short-term renewals, leaving the industry uncertain
10
25
about how much to invest. However, experts agree that wind
0 0 power’s growth will continue, because only a small portion
1996 1998 2000 2002 2004 2006 2008 2010 2012 of this resource is currently being tapped and because wind
Year
power at favorable locations already generates electricity at
Figure 21.13 Global production of wind power has been prices nearly as low as fossil fuels (see Figure 21.5). A 2008
doubling every three years in recent years, and prices have report by a consortium of experts outlined how the United
fallen slightly. Data from Global Wind Energy Council; and U.S. Department States could meet fully one-fifth of its electrical demands with
of Energy, EERE, 2012. 2011 Wind technologies market report. wind power by 2030. 613
M21_WITH7428_05_SE_C21.indd 613 12/12/14 4:29 PM