
Page 616 - Environment: The Science Behind the Stories
P. 616
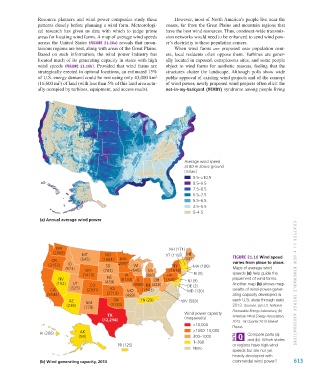
Resource planners and wind power companies study these   However, most of North America’s people live near the
                        patterns closely before planning a wind farm. Meteorologi-  coasts, far from the Great Plains and mountain regions that
                        cal research has given us data with which to judge prime   have the best wind resources. Thus, continent-wide transmis-
                        areas for locating wind farms. A map of average wind speeds   sion networks would need to be enhanced to send wind pow-
                        across the United States (Figure 21.16a) reveals that moun-  er’s electricity to these population centers.
                        tainous regions are best, along with areas of the Great Plains.   When wind farms  are proposed near population cent-
                        Based on such information, the wind power industry has   ers,  local  residents  often  oppose  them. Turbines  are  gener-
                        located much of its generating capacity in states with high   ally located in exposed, conspicuous sites, and some people
                        wind  speeds  (Figure 21.16b).  Provided that  wind  farms  are   object to wind farms for aesthetic reasons, feeling that the
                        strategically erected in optimal locations, an estimated 15%   structures clutter the landscape. Although polls show wide
                        of U.S. energy demand could be met using only 43,000 km    public approval of existing wind projects and of the concept
                                                                         2
                                 2
                        (16,600 mi ) of land (with less than 5% of this land area actu-  of wind power, newly proposed wind projects often elicit the
                        ally occupied by turbines, equipment, and access roads).  not-in-my-backyard (NIMby) syndrome among people living


                                                                                     Average wind speed
                                                                                     at 80 m above ground
                                                                                     (m/sec)
                                                                                        9.5–>10.5
                                                                                        8.5–9.5
                                                                                        7.5–8.5
                                                                                        6.5–7.5
                                                                                        5.5–6.5
                                                                                        4.5–5.5
                                                                                        0–4.5
                         (a) Annual average wind power


                                WA                                             NH (171)
                               (2808)      MT       ND                       VT (119)  ME
                              OR          (645)    (1681)  MN                        (431)               Figure 21.16 Wind speed
                                                                                                         varies from place to place.
                             (3153)  ID             SD   (2987)  WI             NY      MA (100)
                                    (973)   WY      (783)      (648)  MI       (1638)                    Maps of average wind
                                           (1410)           IA       (988)    PA         RI (9)          speeds (a) help guide the
                                 NV                  NE    (5133)  IL   OH  (1340)    NJ (9)             placement of wind farms.
                                (152)  UT     CO    (459)      (3568) IN  (428)       DE (2)             Another map (b) shows meg-  CHAPTER 21 • N E w R ENE wA bl E  E NER gy AlTERN AT iv E s
                              CA      (325)  (2301)   KS     MO    (1543)             MD (120)           awatts of wind-power-gener-
                            (5544)                   (2713)  (459)                                       ating capacity developed in
                                     AZ     NM          OK         TN (29)          WV (583)             each U.S. state through early
                                    (238)   (778)     (3134)                                             2013. Sources: (a) U.S. National
                                                     TX                              Wind power capacity  Renewable Energy Laboratory; (b)
                                                                                                         American Wind Energy Association,
                                                   (12,214)                          (megawatts)         2013. 1st Quarter 2013 Market
                                                                                        >10,000          Report.
                         HI (206)         AK                                            >1000–10,000           Compare parts (a)
                                         (59)                                           300–1000               and (b). Which states
                                                                                        1–300
                                                         PR (125)                                        or regions have high wind
                                                                                        None
                                                                                                         speeds but are not yet
                                                                                                         heavily developed with
                         (b) Wind generating capacity, 2013                                              commercial wind power?   615


           M21_WITH7428_05_SE_C21.indd   615                                                                                    12/12/14   4:29 PM