
Page 559 - Basic College Mathematics with Early Integers
P. 559
Objectives 7.4 COUNTING AND INTRODUCTION TO PROBABILITY
Use a Tree Diagram to Count
Outcomes.
Objective Using a Tree Diagram
Find the Probability of an Event
In our daily conversations, we often talk about the likelihood or probability of a
given result occurring. For example:
The chance of thundershowers is 70 percent.
What are the odds that the New Orleans Saints will go to the Super Bowl?
What is the probability that you will finish cleaning your room today?
Each of these chance happenings—thundershowers, the New Orleans Saints
playing in the Super Bowl, and cleaning your room today—is called an
experiment. The possible results of an experiment are called outcomes. For
example, flipping a coin is an experiment, and the possible outcomes are heads
(H) or tails (T).
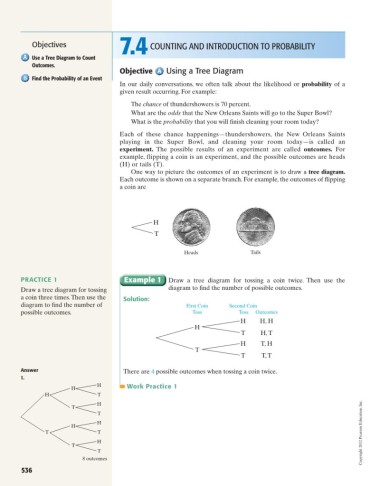
One way to picture the outcomes of an experiment is to draw a tree diagram.
Each outcome is shown on a separate branch. For example, the outcomes of flipping
a coin are
H
T
Heads Tails
PRACTICE 1 Example 1 Draw a tree diagram for tossing a coin twice. Then use the
Draw a tree diagram for tossing diagram to find the number of possible outcomes.
a coin three times.Then use the Solution:
diagram to find the number of First Coin Second Coin
possible outcomes. Toss Toss Outcomes
H H, H
H
T H,T
H T, H
T
T T,T
Answer There are 4 possible outcomes when tossing a coin twice.
1.
H Work Practice 1
H
H T
H
T
T
H
H
T T Copyright 2012 Pearson Education, Inc.
H
T
T
8 outcomes
536