
Page 560 - Basic College Mathematics with Early Integers
P. 560
S E C T ION 7. 4 I COUNTING AND INTRODUCTION TO PROBABILITY 537
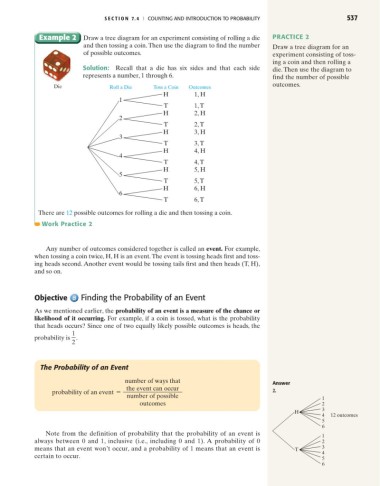
Example 2 Draw a tree diagram for an experiment consisting of rolling a die PRACTICE 2
and then tossing a coin. Then use the diagram to find the number Draw a tree diagram for an
of possible outcomes. experiment consisting of toss-
ing a coin and then rolling a
Solution: Recall that a die has six sides and that each side die. Then use the diagram to
represents a number, 1 through 6. find the number of possible
Die Roll a Die Toss a Coin Outcomes outcomes.
H 1, H
1
T 1,T
H 2, H
2
T 2,T
H 3, H
3
T 3,T
H 4, H
4
T 4,T
H 5, H
5
T 5,T
H 6, H
6
T 6,T
There are 12 possible outcomes for rolling a die and then tossing a coin.
Work Practice 2
Any number of outcomes considered together is called an event. For example,
when tossing a coin twice, H, H is an event.The event is tossing heads first and toss-
ing heads second. Another event would be tossing tails first and then heads (T, H),
and so on.
Objective Finding the Probability of an Event
As we mentioned earlier, the probability of an event is a measure of the chance or
likelihood of it occurring. For example, if a coin is tossed, what is the probability
that heads occurs? Since one of two equally likely possible outcomes is heads, the
1
probability is .
2
The Probability of an Event
number of ways that Answer
the event can occur
probability of an event = 2.
number of possible
1
outcomes 2
3
H
4 12 outcomes
5
6
Note from the definition of probability that the probability of an event is
1
always between 0 and 1, inclusive (i.e., including 0 and 1). A probability of 0 2
means that an event won’t occur, and a probability of 1 means that an event is T 3
4
certain to occur.
5
6