
Page 378 - Using MIS
P. 378
346 Chapter 9 Business Intelligence Systems
Figure 9-5
Joining and
Filtered Tables
have a value of zero for Units. The missing contact data and title data isn’t a problem; Lucas
included it just in case Addison and Drew needed to contact a customer. Because they had their
own contact data, they didn’t need this data. But the values of zero units might be problematic.
At some point, Addison and Drew might need to investigate what these values mean and pos-
sibly correct the data or remove those rows from the analysis. In the immediate term, however,
they decided to proceed even with these incorrect values. You will learn in Q3 that, for a number
of reasons, such problematic data is common in data extracts.
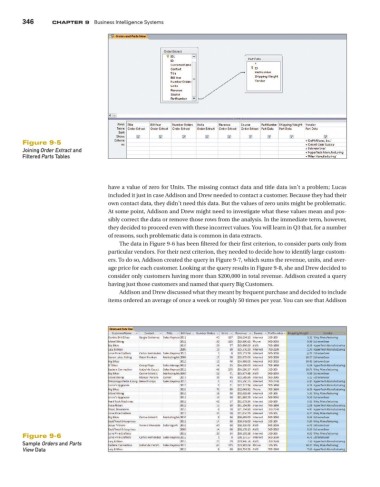
The data in Figure 9-6 has been filtered for their first criterion, to consider parts only from
particular vendors. For their next criterion, they needed to decide how to identify large custom-
ers. To do so, Addison created the query in Figure 9-7, which sums the revenue, units, and aver-
age price for each customer. Looking at the query results in Figure 9-8, she and Drew decided to
consider only customers having more than $200,000 in total revenue. Addison created a query
having just those customers and named that query Big Customers.
Addison and Drew discussed what they meant by frequent purchase and decided to include
items ordered an average of once a week or roughly 50 times per year. You can see that Addison
Figure 9-6
Sample Orders and Parts
View Data