
Page 386 - Using MIS
P. 386
354 Chapter 9 Business Intelligence Systems
Consider the first problem: too many attributes. Suppose we want to know the factors that
influence how customers respond to a promotion. If we combine internal customer data with
purchased customer data, we will have more than a hundred different attributes to consider.
How do we select among them? In Drew and Addison’s case, they just ignored the columns they
didn’t need. But in more sophisticated data mining analyses, too many attributes can be prob-
lematic. Because of a phenomenon called the curse of dimensionality, the more attributes there
are, the easier it is to build a model that fits the sample data but that is worthless as a predictor.
There are other good reasons for reducing the number of attributes, and one of the major activi-
ties in data mining concerns efficient and effective ways of selecting attributes.
The second way to have an excess of data is to have too many data points—too many rows
of data. Suppose we want to analyze clickstream data on CNN.com. How many clicks does that
site receive per month? Millions upon millions! In order to meaningfully analyze such data we
need to reduce the amount of data. One good solution to this problem is statistical sampling.
Organizations should not be reluctant to sample data in such situations.
Data Warehouses Versus Data Marts
To understand the difference between data warehouses and data marts, think of a data ware-
house as a distributor in a supply chain. The data warehouse takes data from the data manufac-
turers (operational systems and other sources), cleans and processes the data, and locates the
data on the shelves, so to speak, of the data warehouse. The data analysts who work with a data
warehouse are experts at data management, data cleaning, data transformation, data relation-
ships, and the like. However, they are not usually experts in a given business function.
A data mart is a data collection, smaller than the data warehouse, that addresses the needs
of a particular department or functional area of the business. If the data warehouse is the dis-
tributor in a supply chain, then a data mart is like a retail store in a supply chain. Users in the
data mart obtain data that pertain to a particular business function from the data warehouse.
Such users do not have the data management expertise that data warehouse employees have,
but they are knowledgeable analysts for a given business function.
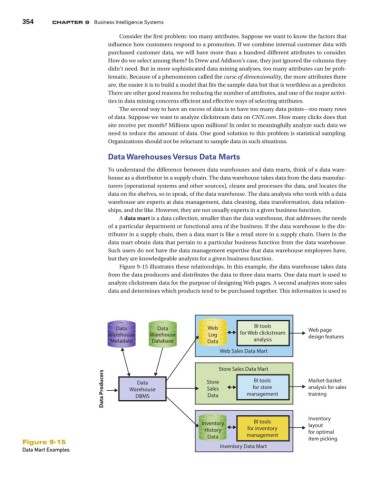
Figure 9-15 illustrates these relationships. In this example, the data warehouse takes data
from the data producers and distributes the data to three data marts. One data mart is used to
analyze clickstream data for the purpose of designing Web pages. A second analyzes store sales
data and determines which products tend to be purchased together. This information is used to
Data Data Web BI tools Web page
Warehouse Warehouse Log for Web clickstream design features
Metadata Database Data analysis
Web Sales Data Mart
Store Sales Data Mart
Data Producers Warehouse Store management Market-basket
BI tools
Data
analysis for sales
for store
Sales
training
Data
DBMS
Inventory
Inventory BI tools layout
History for inventory for optimal
Data management item picking
Figure 9-15
Data Mart Examples Inventory Data Mart