
Page 390 - Using MIS
P. 390
358 Chapter 9 Business Intelligence Systems
Grand Total
J $2,392.83 $20,026.18 $5,064.79 $27,483.80 $2,870.33 $23,598.28 $6,305.14 $32,773.74 $3,050.43 $23,627.83 $6,039.34 $32,717.61 $227.38 $1,960.53 $474.35 $2,662.26 $95,637.41 $7,300.94 $61,597.22 $16,606.41 $85,504.57 $13,517.07 $114,954.83 $29,997.01 $158,468.91 $339,610.90 $339,610.90
Supermarket
I $2,870.33 $23,598.28 $6,305.14 $32,773.74 $3,050.43 $23,627.83 $6,039.34 $32,717.61 $65,491.35 $2,862.45 $23,818.87 $6,428.53 $33,109.85 $7,968.50 $67,915.69 $17,416.38 $93,300.57 $191,901.77 $191,901.77
Small Grocery
H $227.38 $1,960.53 $474.35 $2,662.26 $2,662.26 $458.51 $4,149.19 $1,060.54 $5,668.24 $8,330.51 $8,330.51
Mid-Size Groce
G $1,409.50 $10,392.19 $2,813.73 $14,615.42 $14,615.42 $14,615.42
Gourmet Supermar
F $2,392.83 $20,026.18 $5,064.79 $27,483.80 $27,483.80 $27,483.80 $27,483.80
Store Type
E Deluxe Super $4,438.49 $37,778.35 $10,177.89 $52,394.72 $3,680.56 $32,497.76 $8,706.36 $44,884.68 $97,279.40 $97,279.40
Product Family Drink Food Drink Food Drink Food Drink Food Drink Food Drink Food
D Non-Consumable Non-Consumable Non-Consumable Non-Consumable Non-Consumable Non-Consumable
Store City San Diego
C Beverly Hills Beverly Hills Total Los Angeles Los Angeles Total San Diego Total San Francisco San Francisco Total
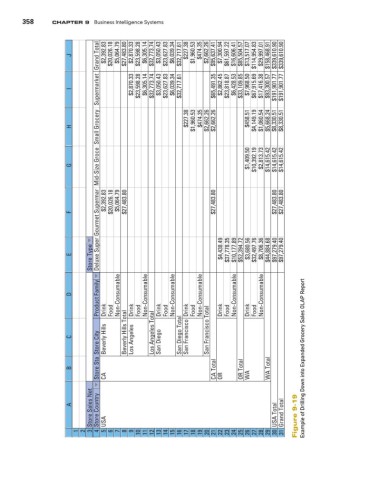
B Store Sta CA CA Total OR OR Total WA WA Total Example of Drilling Down into Expanded Grocery Sales OLAP Report
Store Sales Net Store Country USA Total Grand Total Figure 9-19
A
1 2 3 4 USA 5 6 7 8 9 10 11 12 13 14 15 16 17 18 19 20 21 22 23 24 25 26 27 28 29 30 31