Page 393 - Using MIS
P. 393
Q5  How Do Organizations Use Data Mining Applications?   361

                                           “It’s simple,” he says. “I just ask myself what is the next product they would want to buy.
                                       If someone buys a dive computer, I don’t try to sell her fins. If she’s buying a dive computer,
                                       she’s already a diver and she already has fins. But these dive computer displays are hard to
                                       read. A better mask makes it easier to read the display and get the full benefit from the dive
                                       computer.”
                                           A market-basket analysis is an unsupervised data mining technique for determining sales
                                       patterns. A market-basket analysis shows the products that customers tend to buy together. In
                                       marketing transactions, the fact that customers who buy product X also buy product Y creates
                                       a cross-selling opportunity; that is, “If they’re buying X, sell them Y” or “If they’re buying Y, sell
                                       them X.”
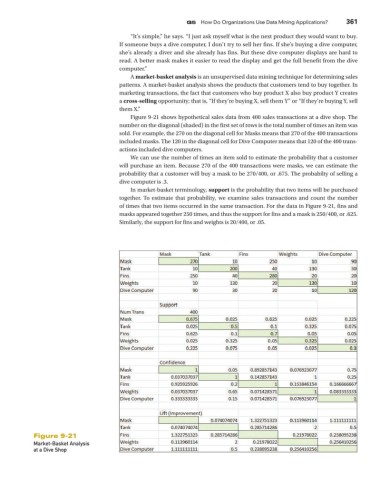
                                           Figure 9-21 shows hypothetical sales data from 400 sales transactions at a dive shop. The
                                       number on the diagonal (shaded) in the first set of rows is the total number of times an item was
                                       sold. For example, the 270 on the diagonal cell for Masks means that 270 of the 400 transactions
                                       included masks. The 120 in the diagonal cell for Dive Computer means that 120 of the 400 trans-
                                       actions included dive computers.
                                           We can use the number of times an item sold to estimate the probability that a customer
                                       will purchase an item. Because 270 of the 400 transactions were masks, we can estimate the
                                       probability that a customer will buy a mask to be 270/400, or .675. The probabilty of selling a
                                       dive computer is .3.
                                           In market-basket terminology, support is the probability that two items will be purchased
                                       together. To estimate that probability, we examine sales transactions and count the number
                                       of times that two items occurred in the same transaction. For the data in Figure 9-21, fins and
                                       masks appeared together 250 times, and thus the support for fins and a mask is 250/400, or .625.
                                       Similarly, the support for fins and weights is 20/400, or .05.


            Figure 9-21
            Market-Basket Analysis
            at a Dive Shop

