Page 396 - Using MIS
P. 396
364       Chapter 9  Business Intelligence Systems


                So
           what?                 Data Storytelling


        Social media, the Internet of Things, CRM, ERP, online business
        transactions, Internet searches, and other activity have generated
        an estimated 2.7 zettabytes of stored data, and 90 percent of that
        data was generated in the past 2 years. 11
           With all that data available, the creation of business
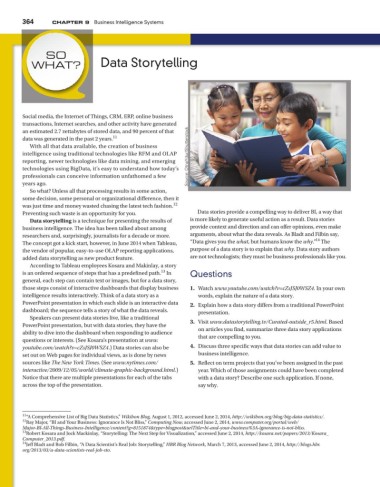
        intelligence using traditional technologies like RFM and OLAP  Source: OtnaYdur/Shutterstock
        reporting, newer technologies like data mining, and emerging
        technologies using BigData, it’s easy to understand how today’s
        professionals can conceive information unfathomed a few
        years ago.
           So what? Unless all that processing results in some action,
        some decision, some personal or organizational difference, then it
                                                         12
        was just time and money wasted chasing the latest tech fashion.
        Preventing such waste is an opportunity for you.         Data stories provide a compelling way to deliver BI, a way that
           Data storytelling is a technique for presenting the results of   is more likely to generate useful action as a result. Data stories
        business intelligence. The idea has been talked about among   provide context and direction and can offer opinions, even make
        researchers and, surprisingly, journalists for a decade or more.   arguments, about what the data reveals. As Bladt and Filbin say,
                                                                                                       14
        The concept got a kick start, however, in June 2014 when Tableau,   “Data gives you the what, but humans know the why.”  The
        the vendor of popular, easy-to-use OLAP reporting applications,   purpose of a data story is to explain that why. Data story authors
        added data storytelling as new product feature.       are not technologists; they must be business professionals like you.
           According to Tableau employees Kosara and Makinlay, a story
                                                     13
        is an ordered sequence of steps that has a predefined path.  In   Questions
        general, each step can contain text or images, but for a data story,
        those steps consist of interactive dashboards that display business   1.  Watch www.youtube.com/watch?v=cZsJSJ0WSZ4. In your own
        intelligence results interactively. Think of a data story as a   words, explain the nature of a data story.
        PowerPoint presentation in which each slide is an interactive data   2.  Explain how a data story differs from a traditional PowerPoint
        dashboard; the sequence tells a story of what the data reveals.  presentation.
           Speakers can present data stories live, like a traditional
        PowerPoint presentation, but with data stories, they have the   3.  Visit www.datastorytelling.tv/Curated-outside_r5.html. Based
                                                                 on articles you find, summarize three data story applications
        ability to dive into the dashboard when responding to audience   that are compelling to you.
        questions or interests. (See Kosara’s presentation at www.
        youtube.com/watch?v=cZsJSJ0WSZ4.) Data stories can also be   4.  Discuss three specific ways that data stories can add value to
        set out on Web pages for individual views, as is done by news   business intelligence.
        sources like The New York Times. (See www.nytimes.com/  5.  Reflect on term projects that you’ve been assigned in the past
        interactive/2009/12/05/world/climate-graphic-background.html.)   year. Which of those assignments could have been completed
        Notice that there are multiple presentations for each of the tabs   with a data story? Describe one such application. If none,
        across the top of the presentation.                      say why.


        11 “A Comprehensive List of Big Data Statistics,” Wikibon Blog, August 1, 2012, accessed June 2, 2014, http://wikibon.org/blog/big-data-statistics/.
        12 Ray Major, “BI and Your Business: Ignorance Is Not Bliss,” Computing Now, accessed June 2, 2014, www.computer.org/portal/web/
        Major-BI-All-Things-Business-Intelligence/content?g=8151874&type=blogpost&urlTitle=bi-and-your-business%3A-ignorance-is-not-bliss.
        13 Robert Kosara and Jock Mackinlay, “Storytelling: The Next Step for Visualization,” accessed June 2, 2014, http://kosara.net/papers/2013/Kosara_
        Computer_2013.pdf.
        14 Jeff Bladt and Bob Filbin, “A Data Scientist’s Real Job: Storytelling,” HBR Blog Network, March 7, 2013, accessed June 2, 2014, http://blogs.hbr.
        org/2013/03/a-data-scientists-real-job-sto.

