
Page 511 - Using MIS
P. 511
Q5 What Are the Keys for Successful SDLC Projects? 479
Only the loosest commitments are made regarding the date of complete and final system func-
tionality. Project sponsors dislike this approach because they feel like they are signing a blank
check, and in fact, they are. But this approach doesn’t treat fictional estimates and schedules as
if they were real, which may be the only other alternative.
The third approach is to attempt to schedule the development project in spite of all the dif-
ficulties. Several different estimation techniques can be used. If the project is similar to a past
project, the schedule data from that past project can be used for planning. When such similar
past projects exist, this technique can produce quality schedule estimates. If there is no such
past project, managers must make the best estimates they can. For computer coding, some
managers estimate the number of lines of code that will need to be written and apply industry or
company averages to estimate the time required. Other coding estimation techniques exist; visit
http://sunset.usc.edu/csse/research/COCOMOII/cocomo_main.html. Of course, lines of code
and other advanced techniques estimate schedules only for software components. The sched-
ules for processes, procedures, databases, and the other components must be estimated using
different methods.
Create a Project Plan
A project plan is a list of WBS tasks, arranged to account for task dependencies, with durations
and resources applied. Some tasks cannot be started or finished until other tasks are completed.
You can’t, for example, put electrical wires in a house until you’ve built the walls. You can define
task dependencies in planning software such as Microsoft Project, and it will arrange the plan
accordingly.
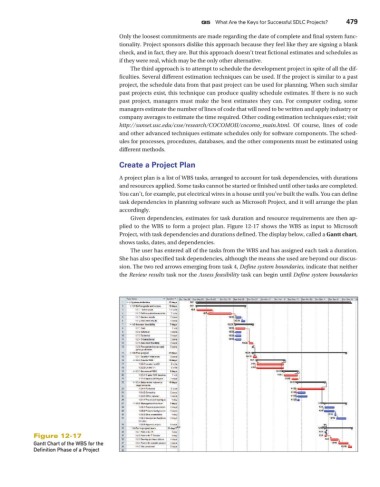
Given dependencies, estimates for task duration and resource requirements are then ap-
plied to the WBS to form a project plan. Figure 12-17 shows the WBS as input to Microsoft
Project, with task dependencies and durations defined. The display below, called a Gantt chart,
shows tasks, dates, and dependencies.
The user has entered all of the tasks from the WBS and has assigned each task a duration.
She has also specified task dependencies, although the means she used are beyond our discus-
sion. The two red arrows emerging from task 4, Define system boundaries, indicate that neither
the Review results task nor the Assess feasibility task can begin until Define system boundaries
Figure 12-17
Gantt Chart of the WBS for the
Definition Phase of a Project