
Page 299 - Fiber Optic Communications Fund
P. 299
280 Fiber Optic Communications
gain increases with distance initially and then it decreases. This is because the pump decays as it propagates
th
through the EDF and at a certain length, the pump power becomes less than or equal to P (Eq. (6.194) is no
p
longer valid in this case) and from Eq. (6.192), we find that g could become zero or negative, which indicates
s
that the signal is attenuated. Physically, when the pump power is less than a certain threshold, erbium ions
pumped to level 2 (via level 3) are not adequate to cause population inversion. From a practical standpoint, it
is desirable to have a low pump threshold so that the population inversion can be achieved at relatively lower
pump powers. From Eq. (6.186), we see that the pump threshold is inversely proportional to the product of
pump absorption cross-section and lifetime associated with the transition from level 2 to level 1, .The
13 21
larger pump absorption cross-section enables higher pump absorption. As a result, more erbium ions make
the transition to level 3 and consequently to level 2. The longer lifetime implies that erbium ions are in
21
the excited level 2 for a longer time. For the erbium-doped silica fiber, the lifetime is very large (∼ 10 ms)
21
and as result, the population inversion can be achieved with a low pump power.
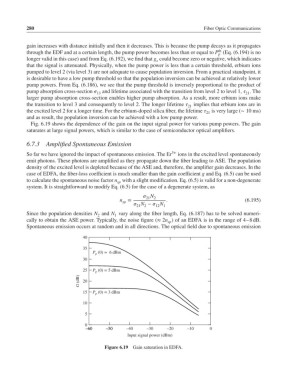
Fig. 6.19 shows the dependence of the gain on the input signal power for various pump powers. The gain
saturates at large signal powers, which is similar to the case of semiconductor optical amplifiers.
6.7.3 Amplified Spontaneous Emission
So far we have ignored the impact of spontaneous emission. The Er 3+ ions in the excited level spontaneously
emit photons. These photons are amplified as they propagate down the fiber leading to ASE. The population
density of the excited level is depleted because of the ASE and, therefore, the amplifier gain decreases. In the
case of EDFA, the fiber-loss coefficient is much smaller than the gain coefficient g and Eq. (6.5) can be used
to calculate the spontaneous noise factor n with a slight modification. Eq. (6.5) is valid for a non-degenerate
sp
system. It is straightforward to modify Eq. (6.5) for the case of a degenerate system, as
N
21 2
n = . (6.195)
sp
N − N
21 2
12 1
Since the population densities N and N vary along the fiber length, Eq. (6.187) has to be solved numeri-
1
2
cally to obtain the ASE power. Typically, the noise figure (≈ 2n ) of an EDFA is in the range of 4–8 dB.
sp
Spontaneous emission occurs at random and in all directions. The optical field due to spontaneous emission
40
35
P p (0) = 6 dBm
30
25 P p (0) = 5 dBm
G (dB) 20
15 P p (0) = 3 dBm
10
5
0
–60–60 – –5050 –40 –30 –20 –10 0
Input signal power (dBm)
Figure 6.19 Gain saturation in EDFA.