
Page 289 - Essentials of Human Communication
P. 289
268 ChaPtEr 13 The Informative Speech
(a) Line graph ● Comparisons and contrasts: Focus on the major similarities and
differences between two ideas, events, or concepts but avoid
60 itemizing every possibility. Consider using a presentation aid
53% ● Statements of fact or a series of facts: Illustrate and support a
that visualizes the most crucial information.
50
Percentage of Time 40 ● Repetition and restatement: Repeat ideas in the same words at
statement for your position by linking the facts to your main
points. State the connections when introducing the facts and
perhaps again after you’ve finished identifying the list of facts.
30
20
words to add clarity and emphasis and to also help compensate
10 16% 17% 14% strategic places during the speech) or restate ideas in different
for the audience’s inevitable lapses in attention.
0
Speaking Reading Writing Listening
(b) Bar graph Objectives self-test
● Can you define examples, illustrations, and narratives; testimony;
numerical data; and definitions as supporting materials in
Listening 53% informative speeches?
● Can you use these forms of supporting materials to effectively
support your assertions?
Writing 14%
Reading 17% Presentation aids
Presentation aids—visual or auditory means for clarifying ideas—
Speaking 16%
can also be considered a form of supporting material. But because
they’re so important in public speaking today, because they’re so
0 10 20 30 40 50 60 numerous and varied, and because technology has provided a
Percentage of Time wealth of alternatives and some pretty sophisticated techniques,
(c) Pie graph we’ll look at presentation aids separately here and will consider
them in detail.
Listening As you plan any type of speech, consider using some kind of
Speaking presentation aid. Ask yourself how you can visually present what
16% you want your audience to remember. For example, if you want
Reading your audience to see the growing impact of the sales tax, consider
Writing showing them a chart of rising sales taxes over the last 10 years. Of
17% 53% course, you can deliver your entire speech supplemented by pro-
jected slides—using PowerPoint or Prezi, for example.
14%
types Of presentatIOn aIds
Be sure to consider the many types of presentation aids you can
choose from when preparing an informative speech:
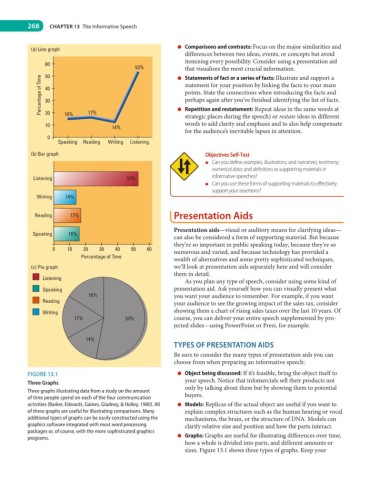
fIGure 13.1 ● Object being discussed: If it’s feasible, bring the object itself to
three Graphs your speech. Notice that infomercials sell their products not
Three graphs illustrating data from a study on the amount only by talking about them but by showing them to potential
of time people spend on each of the four communication buyers.
activities (Barker, Edwards, Gaines, Gladney, & Holley, 1980). All ● Models: Replicas of the actual object are useful if you want to
of these graphs are useful for illustrating comparisons. Many explain complex structures such as the human hearing or vocal
additional types of graphs can be easily constructed using the mechanisms, the brain, or the structure of DNA. Models can
graphics software integrated with most word processing clarify relative size and position and how the parts interact.
packages or, of course, with the more sophisticated graphics
programs. ● Graphs: Graphs are useful for illustrating differences over time,
how a whole is divided into parts, and different amounts or
sizes. Figure 13.1 shows three types of graphs. Keep your