
Page 290 - Essentials of Human Communication
P. 290
Presentation Aids 269
graphs as simple as possible, limiting the number of items to five
or fewer and be sure you add the legend, the labels, and the nu-
merical values you wish to emphasize.
● word chart: You can use a word chart (which also can contain Culture Shock
numbers and graphics) to identify the key points of one of your
propositions or of your entire speech. Figure 13.2 is an example Honeymoon
of a simple word chart that identifies the major topics discussed
in a speech on culture shock. The word chart in Figure 13.3, an Crisis
organizational chart, clarifies relationships among roles in an or-
ganization, and Figure 13.4, a flowchart, identifies the steps in a Recovery
process.
● Maps: You can use maps to illustrate the locations of geographic Adjustment
features, population densities, immigration patterns, world literacy
rates, varied economic conditions, the spread of diseases, and hun-
dreds of other issues you may wish to examine in your speeches.
● People: If you want to demonstrate the muscles of the body, dif-
ferent voice patterns or hairstyles, consider using people as your
aids. Their presence also helps to secure and maintain the atten- fIGure 13.2
tion and interest of the audience.
● Photographs and illustrations. Types of trees, styles of art, kinds of a word Chart
exercise machines, and the horrors of war—all of these can be The word chart is helpful when your main ideas can be clearly
explained in key words or when you wish to emphasize certain
made more meaningful with photographs and illustrations. Be concepts.
sure to project the image in a format large enough for everyone
to see clearly.
Once you’ve decided on the type of presentation aid to use, you need to decide on the
medium you’ll use to present it. Acquire skill in using both low-tech (the whiteboard or flip
chart) and high-tech (presentation software such as PowerPoint or Prezi) resources. A variety Explore the Exercise
of media, with their major uses, and some suggestions for using them effectively are presented “Analyzing Presentation Aids”
in Table 13.1. at MyCommunicationLab
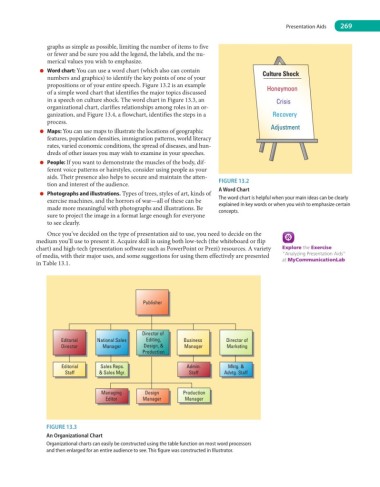
Publisher
Director of
Editorial National Sales Editing, Business Director of
Director Manager Design, & Manager Marketing
Production
Editorial Sales Reps. Admin. Mktg. &
Staff & Sales Mgr. Staff Advtg. Staff
Managing Design Production
Editor Manager Manager
fIGure 13.3
an Organizational Chart
Organizational charts can easily be constructed using the table function on most word processors
and then enlarged for an entire audience to see. This figure was constructed in Illustrator.