
Page 208 - Essencials of Sociology
P. 208
Reactions to Deviance 181
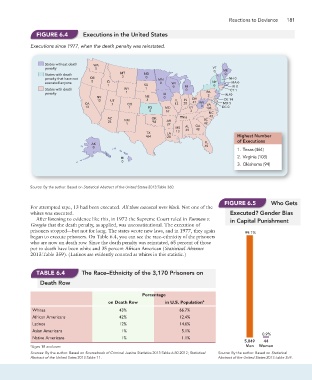
Figure 6.4 Executions in the United States
Executions since 1977, when the death penalty was reinstated.
States without death WA
penalty 5 vt ME
0
States with death MT ND 0
3
penalty that have not OR 0 MN NH 0
executed anyone 2 ID 0 WI NY MA 0
1 SD 0 MI 0 RI 0
States with death WY 1 0 CT 1
penalty 1 IA PA NJ 0
3
NV NE 0 oh
12 ut 3 IL IN DE 14
CA 7 CO 12 20 41 WV VA MD 5
13 1 KS MO KY 0 108 DC 0
0 67 3
NC
AZ OK TN 6 Sc 43
24 NM 94 AR
1 27 GA 42
MS AL 48
13 49
TX LA
464 28 Highest Number
AK FL of Executions
0 69
1. Texas (464)
HI 2. Virginia (108)
0
3. Oklahoma (94)
Source: By the author. Based on Statistical Abstract of the United States 2013:Table 360.
Figure 6.5 Who Gets
For attempted rape, 13 had been executed. All those executed were black. Not one of the
whites was executed. Executed? Gender Bias
After listening to evidence like this, in 1972 the Supreme Court ruled in Furman v. in Capital Punishment
Georgia that the death penalty, as applied, was unconstitutional. The execution of
prisoners stopped—but not for long. The states wrote new laws, and in 1977, they again 99.1%
began to execute prisoners. On Table 6.4, you can see the race–ethnicity of the prisoners
who are now on death row. Since the death penalty was reinstated, 65 percent of those
put to death have been white and 35 percent African American (Statistical Abstract
2013:Table 359). (Latinos are evidently counted as whites in this statistic.)
TABLe 6.4 The Race–Ethnicity of the 3,170 Prisoners on
Death Row
Percentage
on Death Row in U.S. Population a
Whites 43% 66.7%
African Americans 42% 12.4%
Latinos 12% 14.6%
Asian Americans 1% 5.1%
0.9%
Native Americans 1% 1.1%
5,049 44
a Ages 18 and over. Men Women
Sources: By the author. Based on Sourcebook of Criminal Justice Statistics 2013:Table 6.80.2012; Statistical Source: By the author. Based on Statistical
Abstract of the United Sates 2013:Table 11. Abstract of the United States 2013:Table 359.