Page 205 - Essencials of Sociology
P. 205

178     cHAPteR 6               Deviance and social control


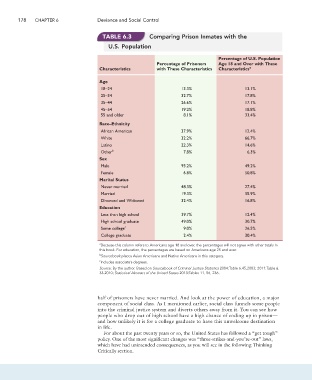
                                                   TABLe 6.3          Comparing Prison Inmates with the

                                                     U.S. Population

                                                                                                  Percentage of U.S. Population
                                                                         Percentage of Prisoners   Age 18 and Over with These
                                                 Characteristics         with These Characteristics  Characteristics a

                                                 Age
                                                  18–24                            13.3%                     13.1%
                                                  25–34                            32.7%                     17.8%
                                                  35–44                            26.6%                     17.1%
                                                  45–54                            19.2%                     18.8%
                                                  55 and older                      8.1%                     33.4%

                                                 Race–Ethnicity
                                                  African American                 37.9%                     12.4%
                                                  White                            32.2%                     66.7%
                                                  Latino                           22.3%                     14.6%
                                                  Other b                           7.8%                      6.3%
                                                 Sex
                                                  Male                             93.2%                     49.2%
                                                  Female                            6.8%                     50.8%
                                                 Marital Status
                                                  Never married                    48.3%                     27.4%
                                                  Married                          19.3%                     55.9%
                                                  Divorced and Widowed             32.4%                     16.8%
                                                 Education
                                                  Less than high school            39.7%                     12.4%
                                                  High school graduate             49.0%                     30.7%
                                                  Some college c                    9.0%                     26.5%
                                                  College graduate                  2.4%                     30.4%
                                                 a Because this column refers to Americans age 18 and over, the percentages will not agree with other totals in
                                                 this book. For education, the percentages are based on Americans age 25 and over.
                                                 b Sourcebook places Asian Americans and Native Americans in this category.
                                                 c Includes associate’s degrees.
                                                 Source: By the author. Based on Sourcebook of Criminal Justice Statistics 2004:Table 6.45.2003; 2011:Table 6.
                                                 33.2010; Statistical Abstract of the United States 2013:Tables 11, 56, 236.


                                                half of prisoners have never married. And look at the power of education, a major
                                                component of social class. As I mentioned earlier, social class funnels some people
                                                into the criminal justice system and diverts others away from it. You can see how
                                                people who drop out of high school have a high chance of ending up in prison—
                                                and how unlikely it is for a college graduate to have this unwelcome destination
                                                in life.
                                                   For about the past twenty years or so, the United States has followed a “get tough”
                                                policy. One of the most significant changes was “three-strikes-and-you’re-out” laws,
                                                which have had unintended consequences, as you will see in the following Thinking
                                                Critically section.
   200   201   202   203   204   205   206   207   208   209   210