Page 200 - Essencials of Sociology
P. 200

the Functionalist Perspective     173


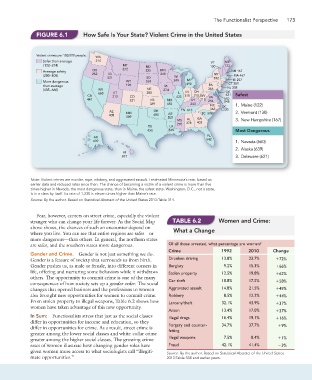
                          Figure 6.1         How Safe Is Your State? Violent Crime in the United States


                          Violent crimes per 100,000 people.  WA
                            Safer than average    314                                            VT    ME
                            (122–274)                        MT       ND                         130  122
                            Average safety       OR          272      225   MN                           NH 167
                            (280–408)           252    ID                   268   WI              NY      MA 467
                                                       221             SD                         392
                                                                                                          RI 257
                            More dangerous                    WY      269         249  MI               CT 281
                            than average                      196             IA       490      PA     NJ 308
                                                                                                       N NJ 308
                            (435–660)              NV                  NE     274               366
                                                                                                       DE
                                                   660   UT            280         IL  IN  OH          DE  Safest
                                                                                                        21
                                              CA         213    CO                 435 315  315 WV  VA  621
                                              441               321     KS     MO        KY  315  214  MD D
                                                                                                      548 8
                                                                        369    455       243     NC  DC    1.  Maine (122)
                                                       AZ     NM          OK         TN  613     363  1,330 0  2.  Vermont (130)
                                                                               AR
                                                       408    589        480   505           SC  598
                                                                                   MS  AL  GA              3.  New Hampshire (167)
                                                                                   270  378  403
                                                                       TX       LA
                                                                       450      549                        Most Dangerous
                                                 AK                                            FL
                                                 639                                           542         1.  Nevada (660)
                                                                                                           2.  Alaska (639)
                                                             HI
                                                            263                                            3.  Delaware (621)
                       Note: Violent crimes are murder, rape, robbery, and aggravated assault. I estimated Minnesota’s rate, based on
                       earlier data and reduced rates since then. The chance of becoming a victim of a violent crime is more than five
                       times higher in Nevada, the most dangerous state, than in Maine, the safest state. Washington, D.C., not a state,
                       is in a class by itself. Its rate of 1,330 is eleven times higher than Maine’s rate.
                       Source: By the author. Based on Statistical Abstract of the United States 2013:Table 314.


                          Fear, however, centers on street crime, especially the violent
                       stranger who can change your life forever. As the Social Map   TABLe 6.2     Women and Crime:
                       above shows, the chances of such an encounter depend on
                       where you live. You can see that entire regions are safer—or   What a Change
                       more dangerous—than others. In general, the northern states
                       are safer, and the southern states more dangerous.       Of all those arrested, what percentage are women?
                                                                                Crime                1992       2010      Change
                       Gender and Crime.  Gender is not just something we do.
                       Gender is a feature of society that surrounds us from birth.   Drunken driving  13.8%    23.7%      172%
                       Gender pushes us, as male or female, into different corners in   Burglary      9.2%      15.3%      166%
                       life, offering and nurturing some behaviors while it withdraws   Stolen property  12.5%  19.8%      162%
                       others. The opportunity to commit crime is one of the many
                       consequences of how society sets up a gender order. The social   Car theft    10.8%      17.5%      158%
                       changes that opened business and the professions to women   Aggravated assault  14.8%    21.5%      145%
                       also brought new opportunities for women to commit crime.   Robbery            8.5%      12.2%      144%
                       From stolen property to illegal weapons, Table 6.2 shows how   Larceny/theft  32.1%      43.9%      137%
                       women have taken advantage of this new opportunity.
                                                                                Arson                13.4%      17.0%      127%
                       In Sum:  Functionalists stress that just as the social classes   Illegal drugs  16.4%    19.1%      116%
                       differ in opportunities for income and education, so they
                       differ in opportunities for crime. As a result, street crime is   Forgery and counter-  34.7%  37.7%  19%
                                                                                feiting
                       greater among the lower social classes and white-collar crime
                       greater among the higher social classes. The growing crime   Illegal weapons   7.5%       8.4%       11%
                       rates of women illustrate how changing gender roles have   Fraud              42.1%      41.4%       23%
                       given women more access to what sociologists call “illegiti-  Source: By the author. Based on Statistical Abstract of the United States
                       mate opportunities.”                                    2013:Table 338 and earlier years.
   195   196   197   198   199   200   201   202   203   204   205