
Page 270 - Essencials of Sociology
P. 270
Poverty 243
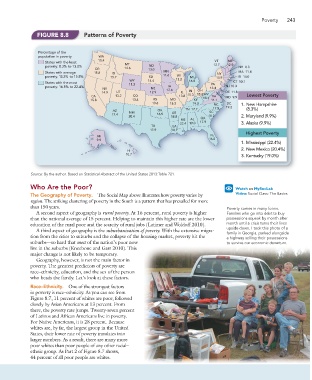
FIGURE 8.8 Patterns of Poverty
Percentage of the
population in poverty WA
13.4 VT ME
States with the least st MT
3.0%
poverty: 8.3% to 13.0% ND 12.7 12.9 NH 8.3
OR 14.6 13.0
States with average e 15.8 ID MN NY MA 11.4
5.8%
poverty: 13.2% to 15.8% 15.7 SD 11.6 WI MI 14.9 RI 14.0
WY 14.4 13.2 16.8
States with the most st 11.2 PA CT 10.1
0.3
22.4%%
poverty: 16.5% to 22.4% IA NJ 10.3
NV NE 12.6 13.4
1.8
14.9 UT 12.9 IL IN OH DE 11.8
CA 13.2 CO 13.8 15.3 15.8WV VA MD 9.9 Lowest Poverty
9.9
18.1
15.8 13.4 KS MO KY 11.1
13.6 15.3 19.0 NC DC 1. New Hampshire
AZ OK TN 17.7 SC 17.5 19.2 (8.3%)
17.4 NM 16.9 AR
20.4 18.8 GA 18.2 2. Maryland (9.9%)
MS AL
22.4 19.0 17.9 3. Alaska (9.9%)
TX LA
17.9 18.7
Highest Poverty
AK FL
9.9 16.5
1. Mississippi (22.4%)
2. New Mexico (20.4%)
HI
10.7
3. Kentucky (19.0%)
Source: By the author. Based on Statistical Abstract of the United States 2013:Table 721.
Who Are the Poor? Watch on MySocLab
The Geography of Poverty. The Social Map above illustrates how poverty varies by Video: Social Class: The Basics
region. The striking clustering of poverty in the South is a pattern that has prevailed for more
than 150 years. Poverty comes in many forms.
A second aspect of geography is rural poverty. At 16 percent, rural poverty is higher Families who go into debt to buy
than the national average of 15 percent. Helping to maintain this higher rate are the lower possessions squeak by month after
education of the rural poor and the scarcity of rural jobs (Latimer and Woldoff 2010). month until a crisis turns their lives
upside down. I took this photo of a
A third aspect of geography is the suburbanization of poverty. With the extensive migra-
family in Georgia, parked alongside
tion from the cities to suburbs and the collapse of the housing market, poverty hit the a highway selling their possessions
suburbs—so hard that most of the nation’s poor now to survive our economic downturn.
live in the suburbs (Kneebone and Garr 2010). This
major change is not likely to be temporary.
Geography, however, is not the main factor in
poverty. The greatest predictors of poverty are
race–ethnicity, education, and the sex of the person
who heads the family. Let’s look at these factors.
Race–Ethnicity. One of the strongest factors
in poverty is race–ethnicity. As you can see from
Figure 8.7, 11 percent of whites are poor, followed
closely by Asian Americans at 13 percent. From
there, the poverty rate jumps. Twenty-seven percent
of Latinos and African Americans live in poverty.
For Native Americans, it is 28 percent. Because
whites are, by far, the largest group in the United
States, their lower rate of poverty translates into
larger numbers. As a result, there are many more
poor whites than poor people of any other racial–
ethnic group. As Part 2 of Figure 8.7 shows,
44 percent of all poor people are whites.