
Page 271 - Essencials of Sociology
P. 271
244 CHAPTER 8 Social Class in the United States
Read on MySocLab FIGURE 8.9
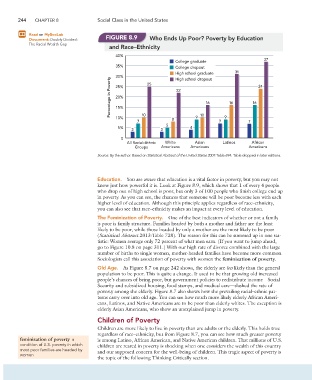
Document: Doubly Divided: Who Ends Up Poor? Poverty by Education
The Racial Wealth Gap
and Race–Ethnicity
40%
37
College graduate
35% College dropout
High school graduate 31
30% 25 High school dropout 24
Percentage in Poverty 20% 22 16 16 16
25%
15%
10%
7 10 8 9 10 7 9 7
5
5% 4
3 3
0
All Racial–Ethnic White Asian Latinos African
Groups Americans Americans Americans
Source: By the author. Based on Statistical Abstract of the United States 2007:Table 694. Table dropped in later editions.
Education. You are aware that education is a vital factor in poverty, but you may not
know just how powerful it is. Look at Figure 8.9, which shows that 1 of every 4 people
who drop out of high school is poor, but only 3 of 100 people who finish college end up
in poverty. As you can see, the chances that someone will be poor become less with each
higher level of education. Although this principle applies regardless of race–ethnicity,
you can also see that race–ethnicity makes an impact at every level of education.
The Feminization of Poverty. One of the best indicators of whether or not a family
is poor is family structure. Families headed by both a mother and father are the least
likely to be poor, while those headed by only a mother are the most likely to be poor
(Statistical Abstract 2013:Table 728). The reason for this can be summed up in one sta-
tistic: Women average only 72 percent of what men earn. (If you want to jump ahead,
go to Figure 10.8 on page 311.) With our high rate of divorce combined with the large
number of births to single women, mother-headed families have become more common.
Sociologists call this association of poverty with women the feminization of poverty.
Old Age. As Figure 8.7 on page 242 shows, the elderly are less likely than the general
population to be poor. This is quite a change. It used to be that growing old increased
people’s chances of being poor, but government policies to redistribute income—Social
Security and subsidized housing, food stamps, and medical care—slashed the rate of
poverty among the elderly. Figure 8.7 also shows how the prevailing racial–ethnic pat-
terns carry over into old age. You can see how much more likely elderly African Ameri-
cans, Latinos, and Native Americans are to be poor than elderly whites. The exception is
elderly Asian Americans, who show an unexplained jump in poverty.
Children of Poverty
Children are more likely to live in poverty than are adults or the elderly. This holds true
regardless of race–ethnicity, but from Figure 8.7, you can see how much greater poverty
feminization of poverty a is among Latino, African American, and Native American children. That millions of U.S.
condition of U.S. poverty in which children are reared in poverty is shocking when one considers the wealth of this country
most poor families are headed by and our supposed concern for the well-being of children. This tragic aspect of poverty is
women
the topic of the following Thinking Critically section.