Page 347 - Essencials of Sociology
P. 347

320    CHAPTER 10               Gender and Age


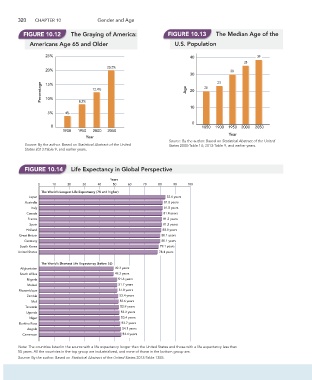
         FIGURE 10.12        The Graying of America:                FIGURE 10.13        The Median Age of the
         Americans Age 65 and Older                                    U.S. Population


                  25%                                                        40                         39
                                                                                                   35
                                           20.2%
                  20%                                                                         30
                                                                             30         23
                Percentage  15%      12.4%                                  Age  20  20


                  10%
                                8.2%
                                                                             10
                   5%     4%
                                                                              0
                    0                                                             1850  1900  1950  2000  2050
                         1900  1950  2000  2050
                                                                                             Year
                                   Year
                                                                    Source: By the author. Based on Statistical Abstract of the United
          Source: By the author. Based on Statistical Abstract of the United   States 2000:Table 14; 2013:Table 9, and earlier years.
          States 2013:Table 9, and earlier years.


          FIGURE 10.14       Life Expectancy in Global Perspective

                                             Years
               0     10    20    30    40     50    60    70    80    90    100
                The World’s Longest Life Expectancy (78 and higher)
           Japan                                                    83.6 years
          Australia                                                81.8 years
            Italy                                                 81.8 years
          Canada                                                  81.4 years
           France                                                 81.2 years
            Spain                                                 81.2 years
          Holland                                                 80.8 years
       Great Britain                                             80.1 years
          Germany                                                80.1 years
        South Korea                                              79.1 years
       United States                                            78.4 years

                The World’s Shortest Life Expectancy (below 55)
        Afghanistan                           49.3 years
        South Africa                          49.3 years
           Nigeria                              51.6 years
           Malawi                               51.7 years
       Mozambique                               51.8 years
           Zambia                               52.4 years
            Mali                                52.6 years
          Tanzania                               52.9 years
          Uganda                                 53.2 years
            Niger                                53.4 years
       Burkina Faso                              53.7 years
           Angola                                54.1 years
         Cameroon                                 54.4 years


       Note: The countries listed in the source with a life expectancy longer than the United States and those with a life expectancy less than
       55 years. All the countries in the top group are industrialized, and none of those in the bottom group are.
       Source: By the author. Based on Statistical Abstract of the United States 2013:Table 1355.
   342   343   344   345   346   347   348   349   350   351   352