Page 368 - Essencials of Sociology
P. 368

the U.S. political System     341


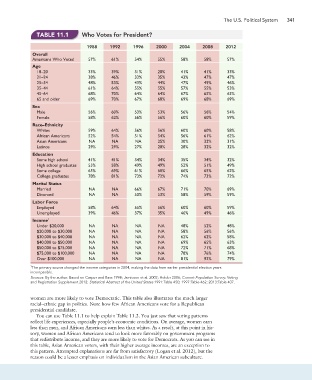
                          Table 11.1        Who Votes for President?

                                              1988      1992     1996      2000     2004     2008      2012
                        Overall
                        Americans Who Voted    57%      61%       54%      55%       58%      58%       57%
                        Age
                          18–20                33%      39%       31%      28%       41%      41%       33%
                          21–24                38%      46%       33%      35%       43%      47%       47%
                          25–34                48%      53%       43%      44%       47%      49%       46%
                          35–44                61%      64%       55%      55%       57%      55%       53%
                          45–64                68%      70%       64%      64%       67%      65%       63%
                          65 and older         69%      70%       67%      68%       69%      68%       69%
                        Sex
                          Male                 56%      60%       53%      53%       56%      56%       54%
                          Female               58%      62%       56%      56%       60%      60%       59%
                        Race–Ethnicity
                          Whites               59%      64%       56%      56%       60%      60%       58%
                          African Americans    52%      54%       51%      54%       56%      61%       62%
                          Asian Americans      NA       NA        NA       25%       30%      32%       31%
                          Latinos              29%      29%       27%      28%       28%      32%       32%
                        Education
                          Some high school     41%      41%       34%      34%       35%      34%       32%
                          High school graduates  55%    58%       49%      49%       52%      51%       49%
                          Some college         65%      69%       61%      60%       66%      65%       62%
                          College graduates    78%      81%       73%      72%       74%      73%       72%
                        Marital Status
                          Married              NA       NA        66%      67%       71%      70%       69%
                          Divorced             NA       NA        50%      53%       58%      59%       59%
                        Labor Force
                          Employed             58%      64%       55%      56%       60%      60%       59%
                          Unemployed           39%      46%       37%      35%       46%      49%       46%
                        Income 1
                          Under $20,000        NA       NA        NA       NA        48%      52%       48%
                          $20,000 to $30,000   NA       NA        NA       NA        58%      56%       56%
                          $30,000 to $40,000   NA       NA        NA       NA        62%      62%       58%
                          $40,000 to $50,000   NA       NA        NA       NA        69%      65%       63%
                          $50,000 to $75,000   NA       NA        NA       NA        72%      71%       68%
                          $75,000 to $100,000  NA       NA        NA       NA        78%      76%       74%
                          Over $100,000        NA       NA        NA       NA        81%      92%       79%
                       1 The primary source changed the income categories in 2004, making the data from earlier presidential election years
                       incompatible.
                       Sources: By the author. Based on Casper and Bass 1998; Jamieson et al. 2002; Holder 2006; Current Population Survey: Voting
                       and Registration Supplement 2012; Statistical Abstract of the United States 1991:Table 450; 1997:Table 462; 2013:Table 407.


                       women are more likely to vote Democratic. This table also illustrates the much larger
                       racial–ethnic gap in politics. Note how few African Americans vote for a Republican
                       presidential candidate.
                          You can use Table 11.1 to help explain Table 11.2. You just saw that voting patterns
                       reflect life experiences, especially people’s economic conditions. On average, women earn
                       less than men, and African Americans earn less than whites. As a result, at this point in his-
                       tory, women and African Americans tend to look more favorably on government programs
                       that redistribute income, and they are more likely to vote for Democrats. As you can see in
                       this table, Asian American voters, with their higher average incomes, are an exception to
                       this pattern. Attempted explanations are far from satisfactory (Logan et al. 2012), but the
                       reason could be a lesser emphasis on individualism in the Asian American subculture.
   363   364   365   366   367   368   369   370   371   372   373