
Page 34 - BJS vol. 36
P. 34
26 Bangladesh J. Sugarcane, 36 : 22-28 June, 2015
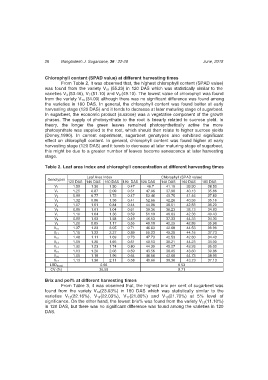
Chlorophyll content (SPAD value) at different harvesting times
From Table 2, it was observed that, the highest chlorophyll content (SPAD value)
was found from the variety V 11 (55.23) in 120 DAS which was statistically similar to the
varieties V 3 (53.46), V 7 (51.10) and V 9 (49.10). The lowest value of chlorophyll was found
from the variety V 13 (34.00) although there was no significant difference was found among
the varieties in 180 DAS. In general, the chlorophyll content was found better at early
harvesting stage (120 DAS) and it tends to decrease at later maturing stage of sugarbeet.
In sugarbeet, the economic product (sucrose) was a vegetative component of the growth
phases. The supply of photosynthate to the root is linearly related to sucrose yield. In
theory, the longer the green leaves remained photosynthetically active the more
photosynthate was supplied to the root, which should then relate to higher sucrose yields
(Doney,1990). In current experiment, sugarbeet genotypes also exhibited significant
effect on chlorophyll content. In general, chlorophyll content was found higher at early
harvesting stage (120 DAS) and it tends to decrease at later maturing stage of sugarbeet,
this might be due to a greater number of leaves become senescence at later harvesting
stage.
Table 2. Leaf area index and chlorophyll concentration at different harvesting times
Leaf Area Index Chlorophyll (SPAD value)
Genotypes
120 DAS 140 DAS 160 DAS 180 DAS 120 DAS 140 DAS 160 DAS 180 DAS
V 1 1.59 1.30 1.50 0.47 46.7 41.10 39.90 38.50
V 2 1.25 0.87 2.09 0.51 47.06 37.98 40.13 35.66
V 3 0.99 0.77 1.72 0.47 53.46 40.75 41.46 37.83
V 4 1.32 0.86 1.36 0.41 52.66 42.26 40.56 35.16
V 5 1.07 1.01 0.84 0.44 44.06 38.51 42.83 36.20
V 6 0.86 1.01 1.04 0.61 39.36 36.23 38.13 34.83
V 7 1.10 1.04 1.36 0.59 51.10 46.63 42.36 40.43
V 8 0.99 1.03 1.58 0.49 46.53 37.33 44.33 34.30
V 9 1.20 0.85 1.17 0.55 49.10 42.25 42.86 35.96
V 10 1.37 1.23 3.05 0.71 46.63 42.68 44.53 36.96
V 11 1.15 1.22 2.37 0.89 55.23 45.28 44.16 37.73
V 12 1.48 1.11 1.69 0.73 47.73 42.53 42.60 34.43
V 13 1.09 1.20 1.95 0.61 40.13 38.21 44.23 34.00
V 14 1.32 1.23 1.74 0.80 44.30 40.27 43.26 36.00
V 15 1.03 1.20 2.08 0.59 43.56 38.05 43.60 39.86
V 16 1.05 1.18 1.96 0.64 46.56 42.68 44.73 38.96
V 17 1.13 1.36 2.11 0.58 40.66 39.36 43.73 37.13
LSD (0.05) 0.66 6.53
CV (%) 35.58 9.71
Brix and pol% at different harvesting times
From Table 3, it was observed that, the highest brix per cent of sugarbeet was
found from the variety V 16 (23.03%) in 160 DAS which was statistically similar to the
varieties V 12 (22.16%), V 11 (22.03%), V 17 (21.80%) and V 10 (21.70%) at 5% level of
significance. On the other hand, the lowest brix% was found from the variety V 13 (11.10%)
in 120 DAS, but there was no significant difference was found among the varieties in 120
DAS.