
Page 97 - FINAL CFA II SLIDES JUNE 2019 DAY 5.2
P. 97
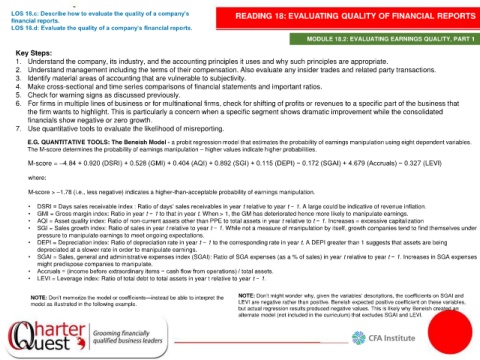
LOS 18.c: Describe how to evaluate the quality of a company’s       READING 18: EVALUATING QUALITY OF FINANCIAL REPORTS
    financial reports.
    LOS 18.d: Evaluate the quality of a company’s financial reports.
                                                                                             MODULE 18.2: EVALUATING EARNINGS QUALITY, PART 1
      Key Steps:
      1. Understand the company, its industry, and the accounting principles it uses and why such principles are appropriate.
      2. Understand management including the terms of their compensation. Also evaluate any insider trades and related party transactions.
      3. Identify material areas of accounting that are vulnerable to subjectivity.
      4. Make cross-sectional and time series comparisons of financial statements and important ratios.
      5. Check for warning signs as discussed previously.
      6. For firms in multiple lines of business or for multinational firms, check for shifting of profits or revenues to a specific part of the business that
         the firm wants to highlight. This is particularly a concern when a specific segment shows dramatic improvement while the consolidated
         financials show negative or zero growth.
      7. Use quantitative tools to evaluate the likelihood of misreporting.

         E.G. QUANTITATIVE TOOLS: The Beneish Model - a probit regression model that estimates the probability of earnings manipulation using eight dependent variables.
         The M-score determines the probability of earnings manipulation – higher values indicate higher probabilities.

         M-score = –4.84 + 0.920 (DSRI) + 0.528 (GMI) + 0.404 (AQI) + 0.892 (SGI) + 0.115 (DEPI) − 0.172 (SGAI) + 4.679 (Accruals) − 0.327 (LEVI)

         where:
         M-score > –1.78 (i.e., less negative) indicates a higher-than-acceptable probability of earnings manipulation.

         •  DSRI = Days sales receivable index : Ratio of days’ sales receivables in year t relative to year t − 1. A large could be indicative of revenue inflation.
         •  GMI = Gross margin index: Ratio in year t − 1 to that in year t. When > 1, the GM has deteriorated hence more likely to manipulate earnings.
         •  AQI = Asset quality index: Ratio of non-current assets other than PPE to total assets in year t relative to t − 1. Increases = excessive capitalization
         •  SGI = Sales growth index: Ratio of sales in year t relative to year t − 1. While not a measure of manipulation by itself, growth companies tend to find themselves under
            pressure to manipulate earnings to meet ongoing expectations.
         •  DEPI = Depreciation index: Ratio of depreciation rate in year t − 1 to the corresponding rate in year t. A DEPI greater than 1 suggests that assets are being
            depreciated at a slower rate in order to manipulate earnings.
         •  SGAI = Sales, general and administrative expenses index (SGAI): Ratio of SGA expenses (as a % of sales) in year t relative to year t − 1. Increases in SGA expenses
            might predispose companies to manipulate.
         •  Accruals = (income before extraordinary items − cash flow from operations) / total assets.
         •  LEVI = Leverage index: Ratio of total debt to total assets in year t relative to year t − 1.

          NOTE: Don’t memorize the model or coefficients—instead be able to interpret the   NOTE: Don’t might wonder why, given the variables’ descriptions, the coefficients on SGAI and
          model as illustrated in the following example.                 LEVI are negative rather than positive. Beneish expected positive coefficient on these variables,
                                                                         but actual regression results produced negative values. This is likely why Beneish created an
                                                                         alternate model (not included in the curriculum) that excludes SGAI and LEVI.