
Page 206 - BA2 Integrated Workbook - Student 2017
P. 206
Chapter 13
3.2 Contribution breakeven chart
One of the problems with the conventional or basic breakeven chart is that it is not
possible to read contribution directly from the chart. A contribution breakeven chart is
based on the same principles but it shows the variable cost line instead of the fixed
cost line. The same lines for total cost and sales revenue are shown so the
breakeven point and profit can be read off in the same way as with a basic
breakeven chart. However, with this chart it is also possible to read the contribution
for any level of activity.
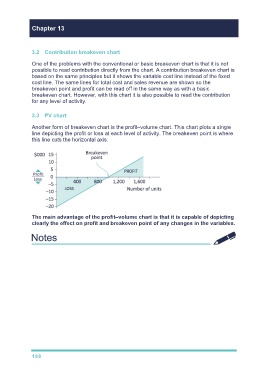
3.3 PV chart
Another form of breakeven chart is the profit–volume chart. This chart plots a single
line depicting the profit or loss at each level of activity. The breakeven point is where
this line cuts the horizontal axis.
The main advantage of the profit–volume chart is that it is capable of depicting
clearly the effect on profit and breakeven point of any changes in the variables.
TYU 9 for contribution breakeven chart
198