Page 33 - BA2 Integrated Workbook - Student 2017
P. 33

Cost identification and classification


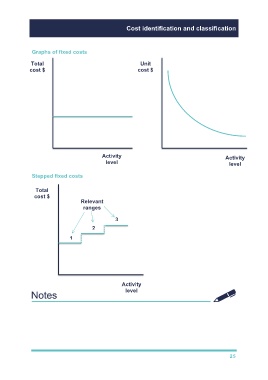
               Graphs of fixed costs

               Total                                           Unit

              cost $                                          cost $


                                              Activity                                               Activity
                                                level
                                                                                                       level
                                                 ion
               Stepped fixed costs

                  Total

                cost $
                                     Relevant
                                      ranges

                                                    3

                                          2

                                1


                                                       Activity
                                                         level


                                                                                                       25
   28   29   30   31   32   33   34   35   36   37   38