
Page 73 - FINAL CFA SLIDES DECEMBER 2018 DAY 4
P. 73
Session Unit 3:
13. Technical Analysis
LOS 13.e: Describe common technical analysis indicators (price-based, momentum
oscillators, sentiment, and flow of funds)., p. 323
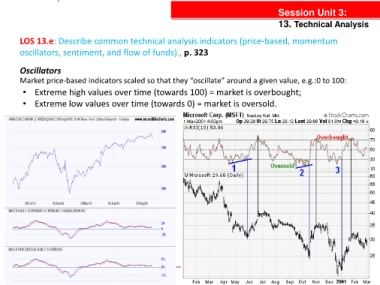
Oscillators
Market price-based indicators scaled so that they “oscillate” around a given value, e.g.:0 to 100:
• Extreme high values over time (towards 100) = market is overbought;
• Extreme low values over time (towards 0) = market is oversold.