
Page 78 - FINAL CFA SLIDES DECEMBER 2018 DAY 4
P. 78
Session Unit 3:
13. Technical Analysis
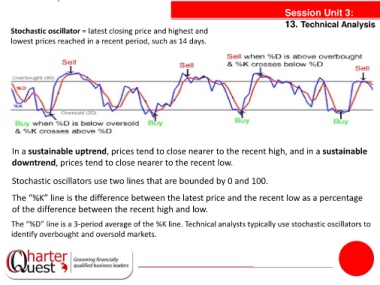
Stochastic oscillator = latest closing price and highest and
lowest prices reached in a recent period, such as 14 days.
In a sustainable uptrend, prices tend to close nearer to the recent high, and in a sustainable
downtrend, prices tend to close nearer to the recent low.
Stochastic oscillators use two lines that are bounded by 0 and 100.
The “%K” line is the difference between the latest price and the recent low as a percentage
of the difference between the recent high and low.
The “%D” line is a 3-period average of the %K line. Technical analysts typically use stochastic oscillators to
identify overbought and oversold markets.