
Page 42 - FINAL CFA II SLIDES JUNE 2019 DAY 3
P. 42
LOS 8.a: Formulate a multiple regression equation to describe the relation
between a dependent variable and several independent variables and
determine the statistical significance of each independent variable. READING 9: TIME SERIES ANALYSIS
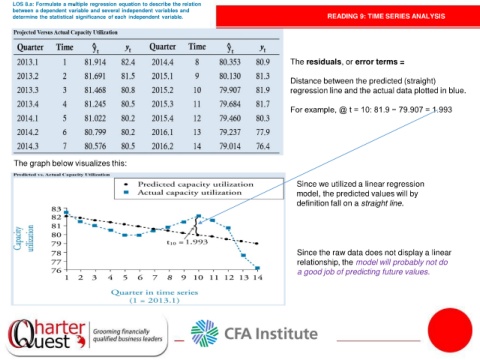
The residuals, or error terms =
Distance between the predicted (straight)
regression line and the actual data plotted in blue.
For example, @ t = 10: 81.9 − 79.907 = 1.993
The graph below visualizes this:
Since we utilized a linear regression
model, the predicted values will by
definition fall on a straight line.
Since the raw data does not display a linear
relationship, the model will probably not do
a good job of predicting future values.