
Page 5 - FINAL CFA II SLIDES JUNE 2019 DAY 2
P. 5
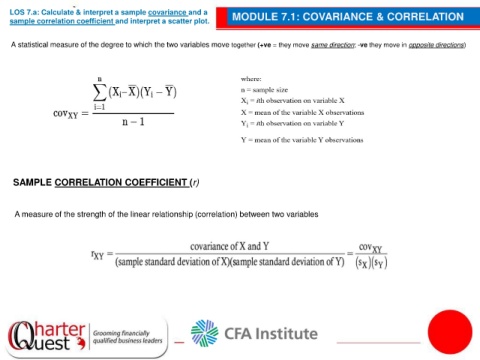
LOS 7.a: Calculate & interpret a sample covariance and a           MODULE 7.1: COVARIANCE & CORRELATION
    sample correlation coefficient and interpret a scatter plot.


    A statistical measure of the degree to which the two variables move together (+ve = they move same direction; -ve they move in opposite directions)


     SAMPLE CORRELATION COEFFICIENT (r)


     A measure of the strength of the linear relationship (correlation) between two variables