Page 365 - Microsoft Word - 00 CIMA F1 Prelims STUDENT 2018.docx
P. 365

Analysis of financial performance and position


               Short term liquidity ratios
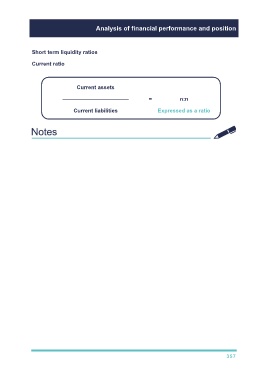
               Current ratio


                                   Current assets

                             ––––––––––––––––––––––                =             n:n

                                  Current liabilities                  Expressed as a ratio


                 TUTOR GUIDANCE

                     Healthy level typically considered as 2:1.
                     If too low – may not be able to repay creditors, risk of being forced into
                      liquidation.

                     If too high may suggest:
                           obsolete inventory
                           poor credit control

                           poor cash management.

                     Must consider industry averages when determining a healthy current ratios
                      e.g. retailers will have lower CR than manufacturers.


                                                                                                      357
   360   361   362   363   364   365   366   367   368   369   370