
Page 202 - BA2 Integrated Workbook STUDENT 2018
P. 202
Chapter 11
3.4 Ogives
An ogive is a graph of the cumulative frequency distributions met earlier.
As with bar charts, the x-axis is the variable being measured and the y-axis is the
corresponding cumulative frequency, the x- and y-values are plotted as follows:
With a discrete variable such as the number of orders placed, the variables can only
be whole numbers (0 or 1 or 2 etc), intermediate x-values have no meaning and so
the ogive would consist of a series of discrete points. It is usual therefore not to draw
it.
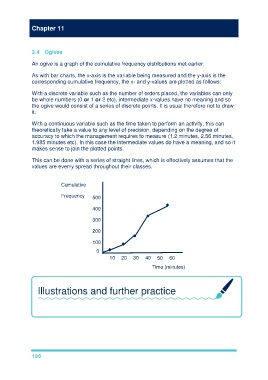
With a continuous variable such as the time taken to perform an activity, this can
theoretically take a value to any level of precision, depending on the degree of
accuracy to which the management requires to measure (1.2 minutes, 2.56 minutes,
1.985 minutes etc). In this case the intermediate values do have a meaning, and so it
makes sense to join the plotted points.
This can be done with a series of straight lines, which is effectively assumes that the
values are evenly spread throughout their classes.
Cumulative
Frequency 500
400
300
200
100
0
10 20 30 40 50 60
Time (minutes)
Illustrations and further practice
Go through illustration 8
196