
Page 205 - BA2 Integrated Workbook STUDENT 2018
P. 205
Risk 1: Summarising and analysing data
Averaging data
We have looked at diagrams and charts which make data easier to use and
understand. We will now look at some common mathematical concepts which help us
to analyse and understand our data.
The first concept to look at is the average.
4.1 Mean
Most people would understand an ‘average’ to be the value obtained by dividing the
sum of the values in question by the number of values.
So if you had the following set of numbers:
7 6 8 9 5 6 7 12 9 4 5 6
The simple average would be (7+6+8+9+5+6+7+12+9+4+5+6) ÷ 12 = 7
This measure is the arithmetic mean, or, where there is no possibility of confusion,
simply the mean.
Note: The mean is denoted as x ̅ , or the mathematical symbol µ.
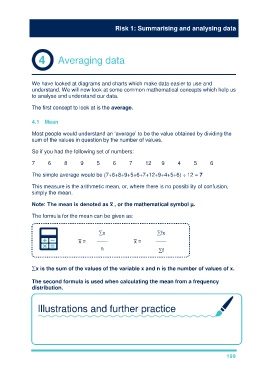
The formula for the mean can be given as:
∑x ∑fx
x ̅ = —— x ̅ = ——
n ∑f
∑x is the sum of the values of the variable x and n is the number of values of x.
The second formula is used when calculating the mean from a frequency
distribution.
Illustrations and further practice
Go through illustration 11 and 12
Try TYU 9
199