
Page 230 - BA2 Integrated Workbook STUDENT 2018
P. 230
Chapter 12
4.1 Characteristics of the normal distribution
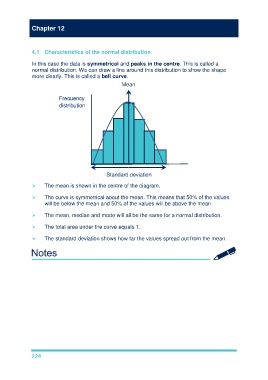
In this case the data is symmetrical and peaks in the centre. This is called a
normal distribution. We can draw a line around this distribution to show the shape
more clearly. This is called a bell curve.
Mean
Frequency
distribution
Standard deviation
The mean is shown in the centre of the diagram.
The curve is symmetrical about the mean. This means that 50% of the values
will be below the mean and 50% of the values will be above the mean.
The mean, median and mode will all be the same for a normal distribution.
The total area under the curve equals 1.
The standard deviation shows how far the values spread out from the mean.
224