
Page 278 - F2 - MA Integrated Workbook STUDENT 2018-19
P. 278
Chapter 12
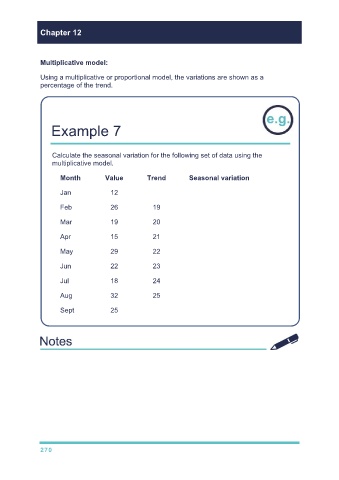
Multiplicative model:
Using a multiplicative or proportional model, the variations are shown as a
percentage of the trend.
Example 7
Calculate the seasonal variation for the following set of data using the
multiplicative model.
Month Value Trend Seasonal variation
Jan 12
Feb 26 19 7/19 × 100 = +37% or 137%
Mar 19 20 –1/20 × 100 = –5% or 95%
Apr 15 21 –6/21 × 100 = –29% or 71%
May 29 22 7/22 × 100 = + 32% or 132%
Jun 22 23 –1/23 × 100 = –4% or 96%
Jul 18 24 –6/24 × 100 = –25% or 75%
Aug 32 25 7/25 × 100 = +28% or 128%
Sept 25
270