
Page 22 - F5 Slides 2017-18
P. 22
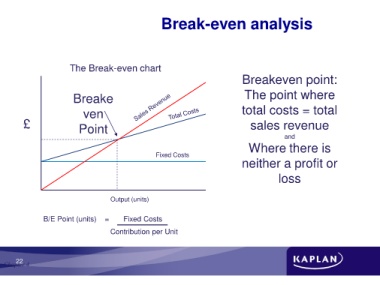
Break-even analysis


                           The Break-even chart
                                                                                             Breakeven point:


                             Breake                                                           The point where

                                 ven                                                         total costs = total

          £                    Point                                                            sales revenue


                                                                                                             and
                                                                                               Where there is

                                                            Fixed Costs
                                                                                             neither a profit or


                                                                                                           loss


                                           Output (units)


                 B/E Point (units)    =       Fixed Costs

                                           Contribution per Unit


       22
  Chapter 4