Page 27 - F5 Slides 2017-18
P. 27

The Profit-Volume Chart


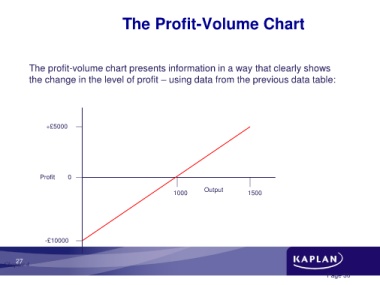
            The profit-volume chart presents information in a way that clearly shows

            the change in the level of profit – using data from the previous data table:


                   +£5000


                Profit     0

                                                                              Output
                                                                   1000                        1500


                  -£10000


       27
  Chapter 4
                                                                                                                             Page 30
   22   23   24   25   26   27   28   29   30   31   32