
Page 22 - CIMA MCS Workbook May 2019 - Day 1 Suggested Solutions
P. 22
CIMA MAY 2019 – MANAGEMENT CASE STUDY
CHAPTER SIX
1. ANALYSIS OF PERFORMANCE AND POSITION
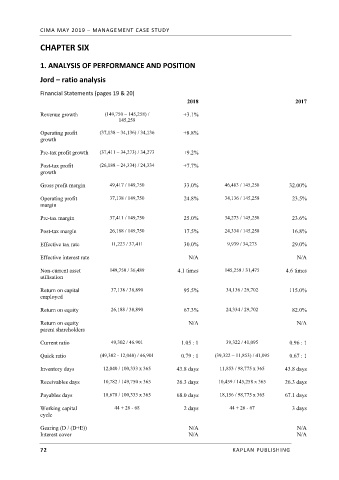
Jord – ratio analysis
Financial Statements (pages 19 & 20)
2018 2017
Revenue growth (149,750 – 145,258) / +3.1%
145,258
Operating profit (37,138 – 34,136) / 34,136 +8.8%
growth
Pre-tax profit growth (37,411 – 34,273) / 34,273 +9.2%
Post-tax profit (26,188 – 24,334) / 24,334 +7.7%
growth
Gross profit margin 49,417 / 149,750 33.0% 46,483 / 145,258 32.00%
Operating profit 37,138 / 149,750 24.8% 34,136 / 145,258 23.5%
margin
Pre-tax margin 37,411 / 149,750 25.0% 34,273 / 145,258 23.6%
Post-tax margin 26,188 / 149,750 17.5% 24,334 / 145,258 16.8%
Effective tax rate 11,223 / 37,411 30.0% 9,939 / 34,273 29.0%
Effective interest rate N/A N/A
Non-current asset 149,750 / 36,489 4.1 times 145,258 / 31,475 4.6 times
utilisation
Return on capital 37,138 / 38,890 95.5% 34,136 / 29,702 115.0%
employed
Return on equity 26,188 / 38,890 67.3% 24,334 / 29,702 82.0%
Return on equity – N/A N/A
parent shareholders
Current ratio 49,302 / 46.901 1.05 : 1 39,322 / 41,095 0.96 : 1
Quick ratio (49,302 - 12,040) / 46,901 0.79 : 1 (39,322 – 11,853) / 41,095 0.67 : 1
Inventory days 12,040 / 100,333 x 365 43.8 days 11,853 / 98,775 x 365 43.8 days
Receivables days 10,782 / 149,750 x 365 26.3 days 10,459 / 145,258 x 365 26.3 days
Payables days 18,678 / 100,333 x 365 68.0 days 18,156 / 98,775 x 365 67.1 days
Working capital 44 + 26 - 68 2 days 44 + 26 - 67 3 days
cycle
Gearing (D / (D+E)) N/A N/A
Interest cover N/A N/A
72 KAPLAN PUBLISHING