
Page 17 - CIMA SCS Workbook August 2018 - Day 1 Suggested Solutions
P. 17
SUGGESTED SOLUTIONS
Chapter Six – F3
EXERCISE 1
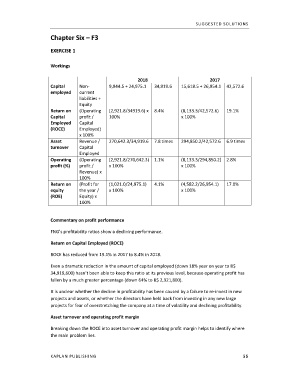
Workings
2018 2017
Capital Non- 9,944.5 + 24,975.1 34,919.6 15,618.5 + 26,954.1 42,572.6
employed current
liabilities +
Equity
Return on (Operating (2,921.8/34919.6) x 8.4% (8,133.3/42,572.6) 19.1%
Capital profit / 100% x 100%
Employed Capital
(ROCE) Employed)
x 100%
Asset Revenue / 270,642.3/34,919.6 7.8 times 294,850.2/42,572.6 6.9 times
turnover Capital
Employed
Operating (Operating (2,921.8/270,642.3) 1.1% (8,133.3/294,850.2) 2.8%
profit (%) profit / x 100% x 100%
Revenue) x
100%
Return on (Profit for (1,021.0/24,975.1) 4.1% (4,582.2/26,954.1) 17.0%
equity the year / x 100% x 100%
(ROE) Equity) x
100%
Commentary on profit performance
FNG’s profitability ratios show a declining performance.
Return on Capital Employed (ROCE)
ROCE has reduced from 19.1% in 2017 to 8.4% in 2018.
Even a dramatic reduction in the amount of capital employed (down 18% year on year to B$
34,919,600) hasn’t been able to keep this ratio at its previous level, because operating profit has
fallen by a much greater percentage (down 64% to B$ 2,921,800).
It is unclear whether the decline in profitability has been caused by a failure to re-invest in new
projects and assets, or whether the directors have held back from investing in any new large
projects for fear of overstretching the company at a time of volatility and declining profitability.
Asset turnover and operating profit margin
Breaking down the ROCE into asset turnover and operating profit margin helps to identify where
the main problem lies.
KAPLAN PUBLISHING 55