
Page 20 - CIMA SCS Workbook August 2018 - Day 1 Suggested Solutions
P. 20
CIMA AUGUST 2018 – STRATEGIC CASE STUDY
Equity finance
FNG is not a listed company, so we can’t calculate ratios like dividend yield and price-earnings
ratio that would help us to assess the shareholders’ view of the company’s performance.
However, we can calculate dividend cover and the results are very interesting – it has reduced
from 1.1 times in 2017 to 0.3 times in 2018. This value less than 1 means that the dividend paid
out in 2018 was far larger than the profit generated! Clearly this is not a sustainable policy.
Looking back further in time (graph on pre-seen page 12) we can see that the dividend has
reduced from nearly B$ 45 million in 2013 to B$ 3 million in 2018. The shareholders are likely to
be very disappointed with this.
It may be that pressure from shareholders forced the directors to pay the $3 million dividend in
the most recent year even though profit was much lower than this. After the dramatic reduction
in dividend over the last few years though, it is likely that the shareholders would have seen even
B$ 3 million as disappointing.
After many years of decline, a crunch moment is approaching for the directors. It is becoming
more and more difficult for them to justify paying out a dividend when the company’s profits are
so low.
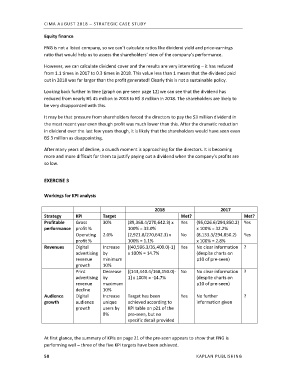
EXERCISE 3
Workings for KPI analysis
2018 2017
Strategy KPI Target Met? Met?
Profitable Gross 30% (89,368.4/270,642.3) x Yes (95,026.6/294,850.2) Yes
performance profit % 100% = 33.0% x 100% = 32.2%
Operating 2.0% (2,921.8/270,642.3) x No (8,133.3/294,850.2) Yes
profit % 100% = 1.1% x 100% = 2.8%
Revenues Digital Increase [(40,596.3/35,400.0)-1] Yes No clear information ?
advertising by x 100% = 14.7% (despite charts on
revenue minimum p10 of pre-seen)
growth 10%
Print Decrease [(143,440.4/168,150.0)- No No clear information ?
advertising by 1] x 100% = -14.7% (despite charts on
revenue maximum p10 of pre-seen)
decline 10%
Audience Digital Increase Target has been Yes No further ?
growth audience unique achieved according to information given
growth users by KPI table on p21 of the
8% pre-seen, but no
specific detail provided
At first glance, the summary of KPIs on page 21 of the pre-seen appears to show that FNG is
performing well – three of the five KPI targets have been achieved.
58 KAPLAN PUBLISHING