
Page 56 - FINAL CFA I SLIDES JUNE 2019 DAY 4
P. 56
Session Unit 3:
13. Technical Analysis
LOS 13.e: Describe common technical analysis indicators (price-based, momentum oscillators,
sentiment, and flow of funds)., p. 323
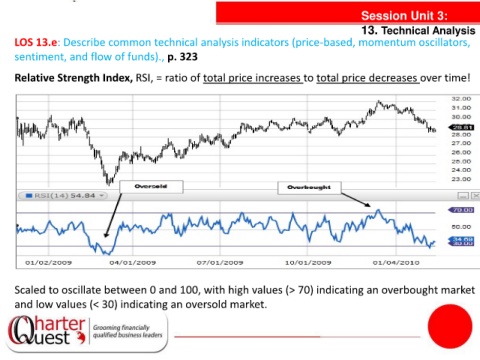
Relative Strength Index, RSI, = ratio of total price increases to total price decreases over time!
Scaled to oscillate between 0 and 100, with high values (> 70) indicating an overbought market
and low values (< 30) indicating an oversold market.