
Page 57 - FINAL CFA I SLIDES JUNE 2019 DAY 4
P. 57
Session Unit 3:
13. Technical Analysis
LOS 13.e: Describe common technical analysis indicators (price-based, momentum oscillators,
sentiment, and flow of funds)., p. 323
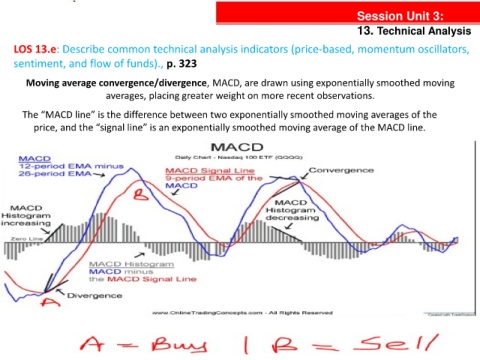
Moving average convergence/divergence, MACD, are drawn using exponentially smoothed moving
averages, placing greater weight on more recent observations.
The “MACD line” is the difference between two exponentially smoothed moving averages of the
price, and the “signal line” is an exponentially smoothed moving average of the MACD line.